The Google Home Plugin for Android Studio is designed and created for Google Home Platform developers. This plugin gives you access to Google Assistant Simulator, Cloud Logging, and other tools to simplify your smart home development process.
Security notice
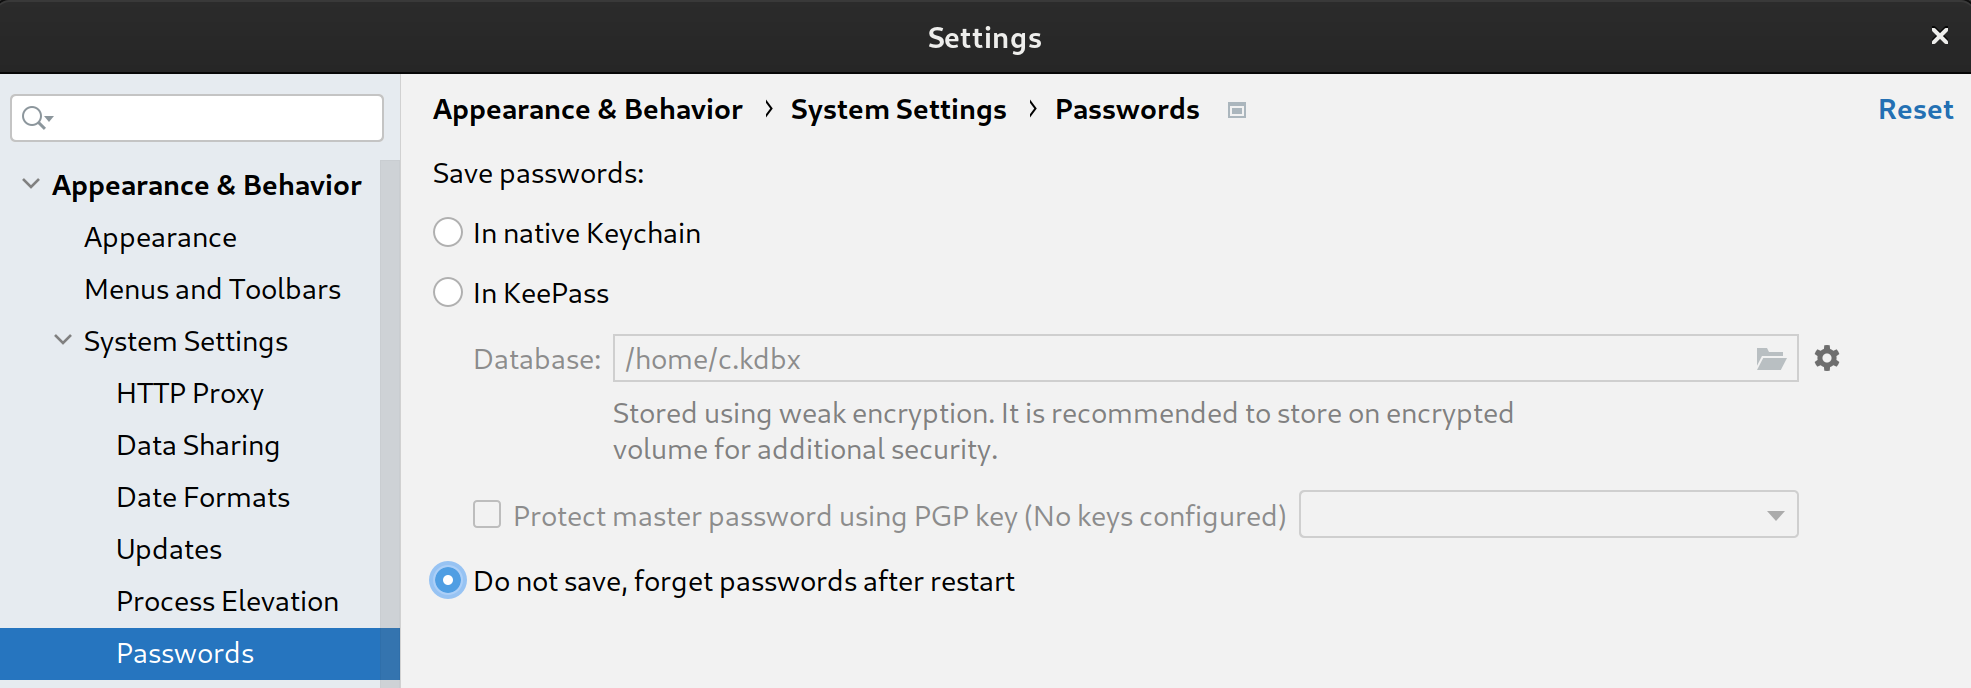
To prevent Android Studio from storing secrets and passwords, complete the following steps:
- Click File, then Settings....
- In Appearance & Behavior, expand System Settings, then click Passwords.
- Select Do not save, forget passwords after restart.
Features
Assistant Simulator
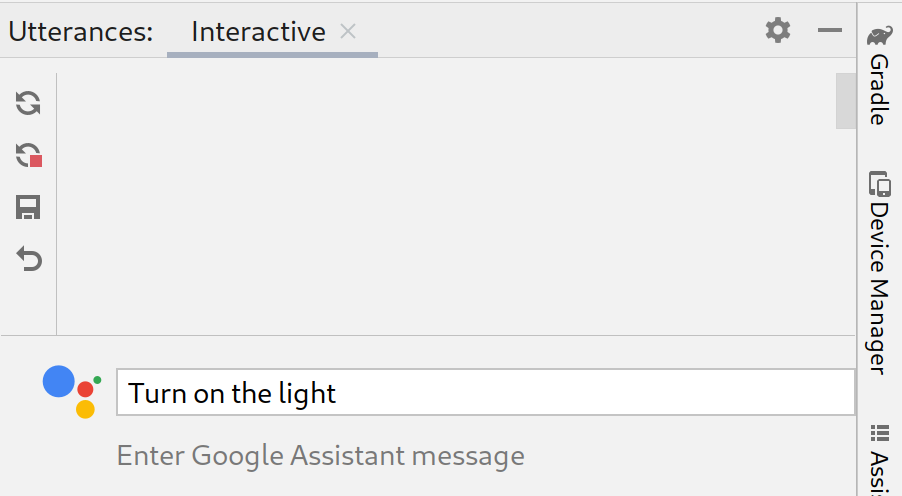
To test whether your smart home devices work properly with the Google Home ecosystem, you can interact with Assistant Simulator at any time without leaving Android Studio.
The Assistant Simulator enables you to easily control your devices by typing your queries, for example, "Turn on the light." Inside Android Studio, Assistant Simulator responds back with text messages based on your commands, for example, "Alright, turning on the light."
View Cloud Logging
Google Cloud Logging provides debugging information and key metrics to give you insights into your Action's usage. To simplify development, the Google Home Plugin shows real-time Cloud Logging messages right next to your code during troubleshooting.
You can display real-time logs or select a date range.
Batch Utterances
Assistant Simulator responses to a single utterance are not deterministic. For example, a response could be any of the following phrases:
- Got it, turning on 2 lights.
- Sure, turning on 2 lights.
- Got it, turning 2 lights on.
- Alright, turning 2 lights on.
To run automated tests and verify how your Google integrations work with these various responses, you can send batch utterances to the Assistant Simulator by running utterance scripts. Once a script is saved, you can collect responses and run multiple tests against your queries.
Home Graph Viewer
Home Graph Viewer allows you to display the state of your devices and launch the Google Home Test Suite in your browser.
Android Debug Bridge (adb) Log Viewer
Adb Log Viewer is a tool to view and analyze log files, for example Matter device log files, Google Home logs, and Android logs.
Install
To install the Google Home Plugin in Android Studio, follow these steps:
- Download or update Android Studio. Download Android Studio
- Go to File > Settings (Android Studio > Preferences on MacOS).
- In the Plugins section, go to Marketplace and search for
google home. - Install the tool and restart Android Studio.
You can also download the plugin directly from the JetBrains Marketplace.
Setup
Once you've installed the plugin, you'll need to complete the following steps before you can use Assistant Simulator and view Cloud Logging:
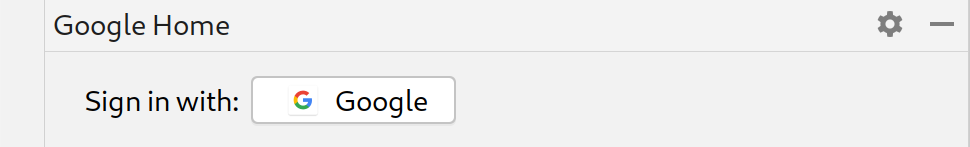
Sign in with Google
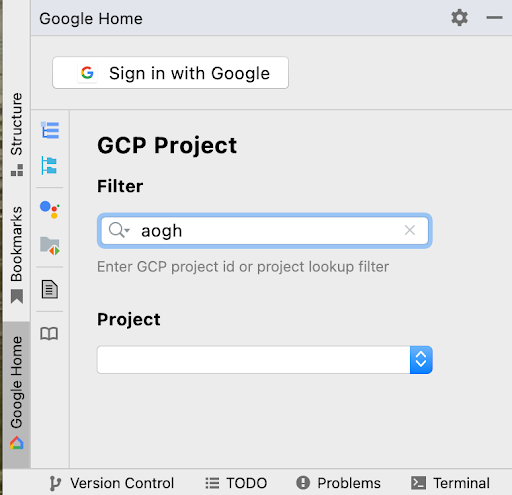
You can sign in to your developer account from the Google Home panel, authorizing Android Studio to communicate with Google services on your behalf.
Click the Google Home tab in the vertical tab column on the left side of the Android Studio window.
For Sign in with, click Google to launch your browser.
Choose the account that is linked with your smart home devices.
On the Sign in with Google authorization page, click Allow.
Close the browser window, and return to Android Studio.
You should now be logged in, with the option to Sign Out.
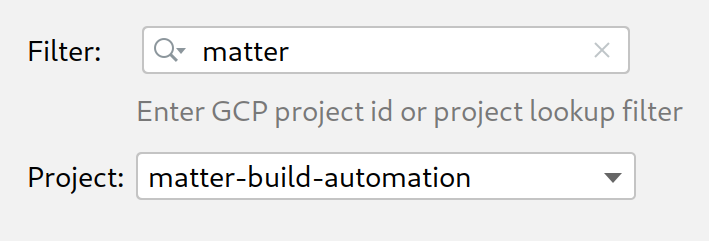
Select a Cloud project
After signing-in, select a Project from the dropdown. To filter your
project list, type a Filter expression, for example matter, then press
Enter.
The Project dropdown loads the first 100 projects based on your Filter. Your selections are retained when you exit Android Studio.
For help with project filters, refer to Query parameters in Google Cloud Reference.
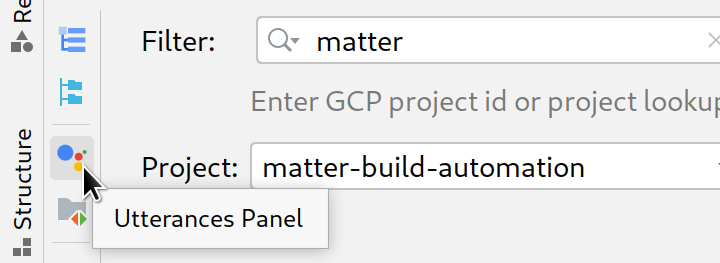
Use the Assistant Simulator
To open the Assistant Simulator in Android Studio, click Utterances Panel from the Google Home Plugin panel.
There are several ways to send queries to the Assistant Simulator. Next, we'll go over each option.
Type queries and collect responses
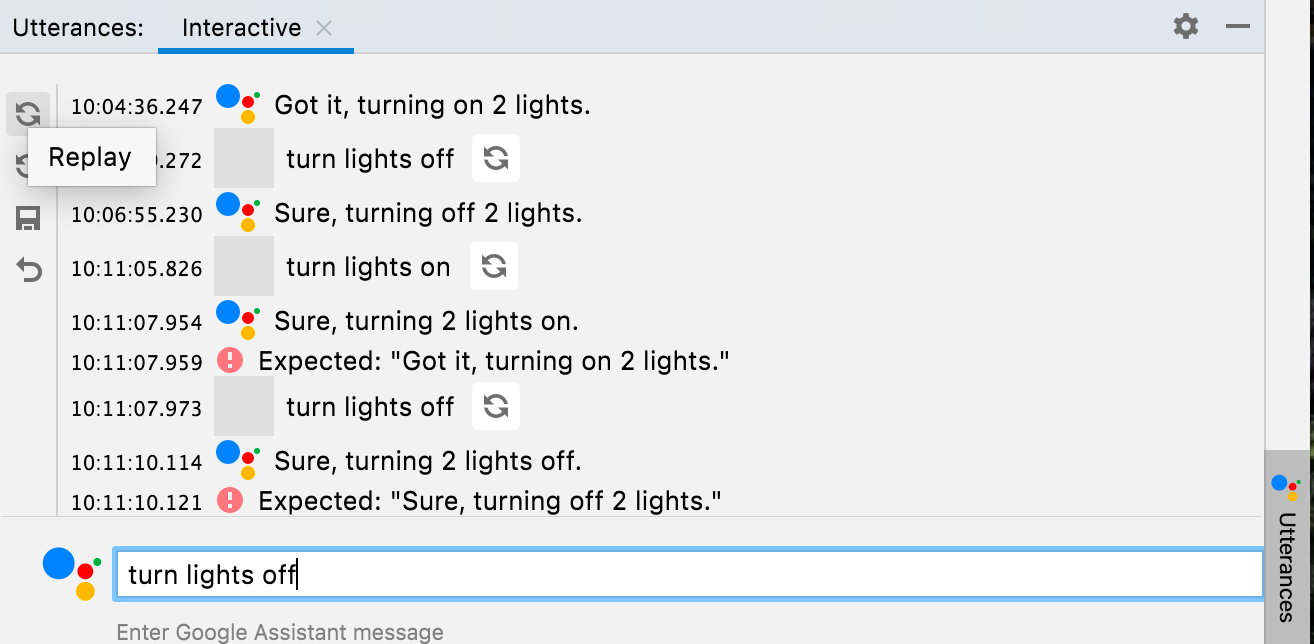
To interact with the Assistant Simulator, type your query and press Enter.
You can resend a query by clicking the resend icon at the end of your query.
After submitting one or more queries, click Replay to re-run your queries and check your responses. The Utterances panel keeps track of your queries and responses in a stored cache. Replay only adds new responses to this internal cache, and won't duplicate your queries every time you click the button.
Click Save to save the queries and responses that you've entered in the Utterances panel. Your interactions are converted to JSON in the following format:
ask: Your query.answers: An array of possible Assistant Simulator responses.
You can edit this JSON file in Android Studio.
{
  "collected": false,
  "lines": [
    {
      "ask": "turn lights on",
      "answers": [
        "OK, turning 2 lights on.",
        "Sure, turning on 2 lights."
      ]
    }
  ]
}
Collect batch responses
From the Google Home Plugin panel, click Utterances File to open
your saved JSON files in a new tab. For Select Path, you can choose a
file or a folder. If you choose a folder, Collect and Test will
work on all utterances .json files in that folder.
You can open multiple tabs for the same file or different files, for example
lights, lights(1), and plug.
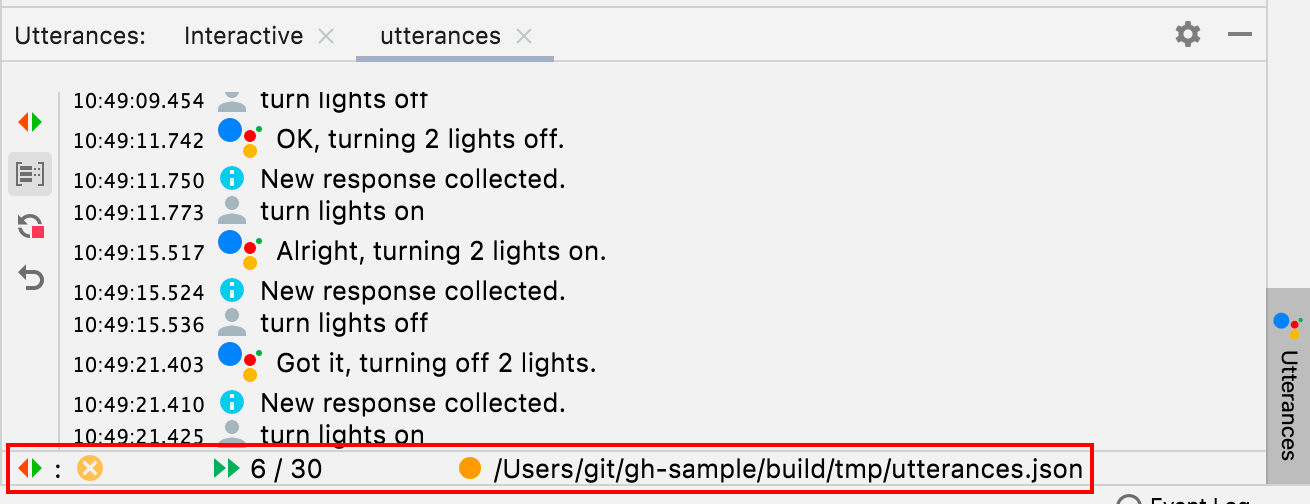
The Status Bar displays the result of your last test (if applicable),
a yellow or green dot to indicate if the file has been collected, and the
utterance .json file path. After you click
Collect,
the Assistant Simulator runs your queries.
You'll be notified when a new response is collected, and the Status Bar
displays a counter while your queries are being processed.
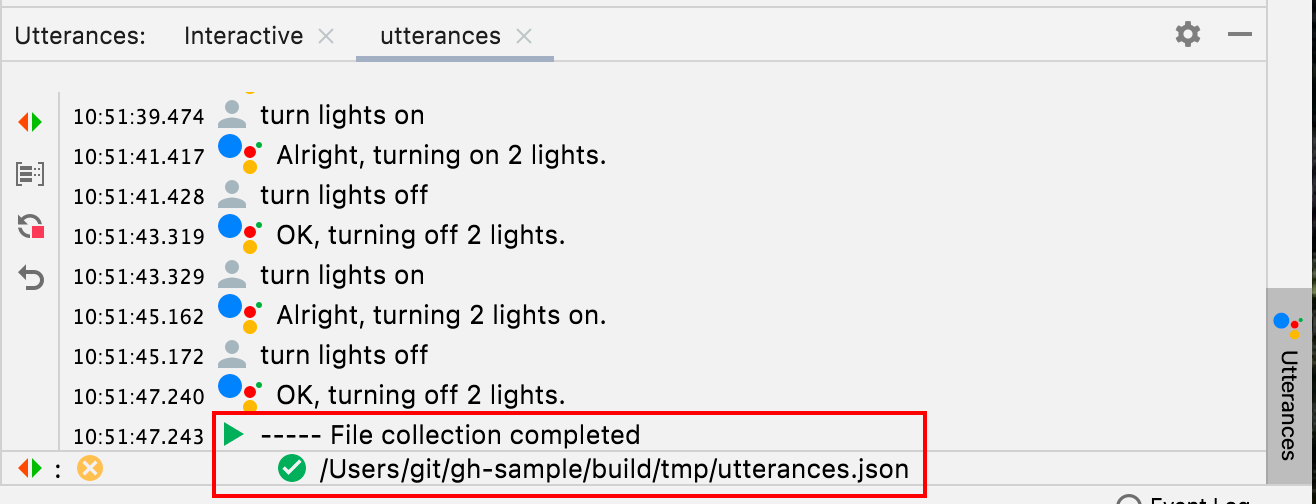
When Collect completes, the Status Bar updates with a green check in
front of your .json path, and your utterance files are populated with
possible responses.
{
  "collected": true,
  "lines": [
    {
      "ask": "turn lights on",
      "answers": [
        "OK, turning 2 lights on.",
        "Sure, turning on 2 lights.",
        "Sure, turning 2 lights on.",
        "Got it, turning 2 lights on.",
        "Alright, turning on 2 lights.",
        "OK, turning on 2 lights.",
        "Got it, turning on 2 lights.",
        "Alright, turning 2 lights on."
      ]
    }
  ]
}
If you Stop the collection early, your .json path will not be marked as
collected.
Test batch utterances
Once you've collected your responses, click Test to replay your queries and check your responses and logs. When you test batch utterances, the Assistant Simulator expects the responses that are saved to your JSON file. If your test returns a response that hasn't been collected, you'll receive a notification that's similar to the following response:
Expected one of: "Got it, turning on
2 lights."
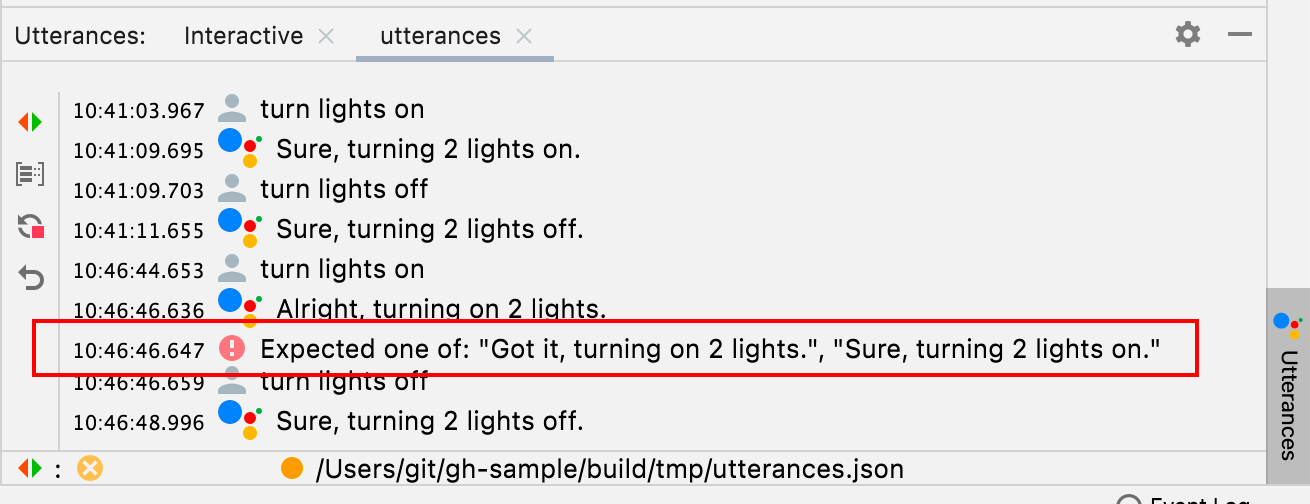
This scenario indicates an unsuccessful test. Otherwise, the Assistant Simulator will run each of your queries and return a response. A check displays in the Status Bar if the test was successful.

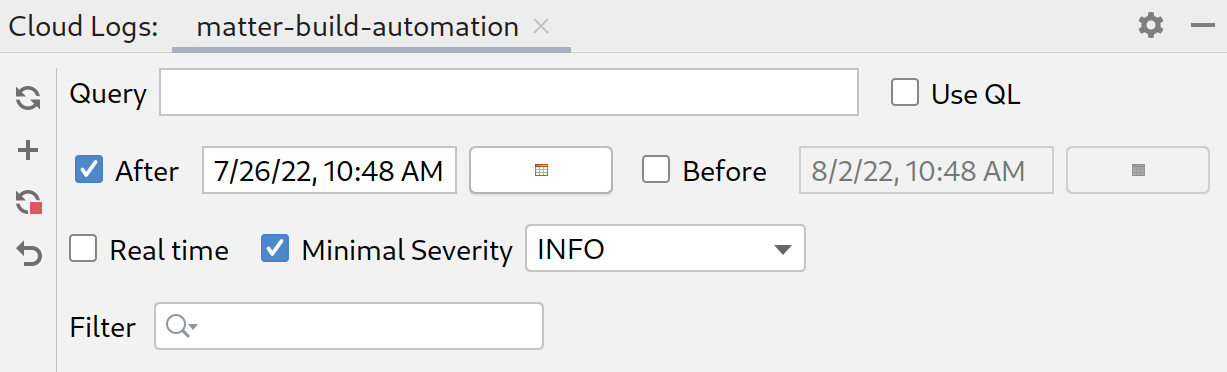
View Cloud Logging
To open a project tab in the Cloud Logs tool window, click Cloud Logs from the Google Home Plugin panel. You can open separate Cloud Log tabs for each of your projects.
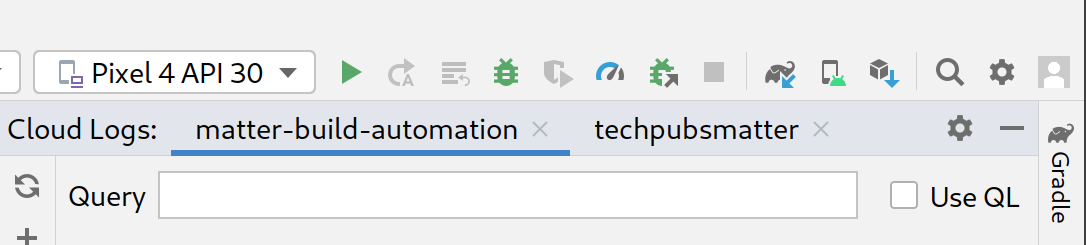
Query terms
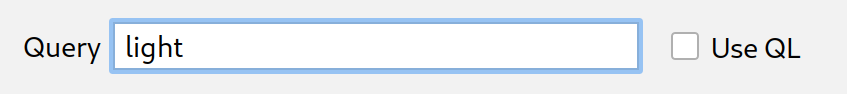
For your selected project, you can also filter logs using the Query field.
For example, to filter logs for a keyword of light:
Select Use QL to use Logging query language.
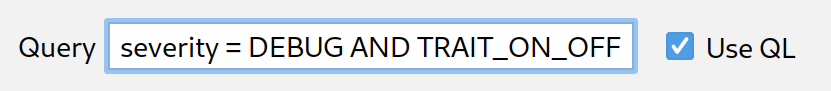
Here are a few examples of QL queries to help you get started:
severity = (DEBUG OR INFO OR NOTICE OR WARNING OR ERROR OR CRITICAL OR ALERT OR EMERGENCY) AND resource.type="assistant_action_project" AND timestamp > "2022-04-07T00:40:18Z"
jsonPayload.executionLog.executionResults.actionResults.action.trait = "TRAIT_ON_OFF"
jsonPayload.executionLog.executionResults.actionResults.action.actionType = "ONOFF_ON"
Date and time queries
Querying logs by date is also optional, and can be enabled by clicking
After and Before. You can type your date and time format in the text
field provided, for example 5/11/22, 12:37 PM, or you can use the date pickers
to select your date, then enter the time in the text field.
- To select a date after
5/1/22, select After and click the date icon . - To select a date before
5/1/22, select Before and click the date icon . - To select a date between
5/1/22and6/30/22, select Before and After and choose your dates from the date icon .
Select Real time to fetch live project logs. Click Stop to end a real-time feed.
Severity level
You can also select a Minimal Severity from the dropdown.
Query results
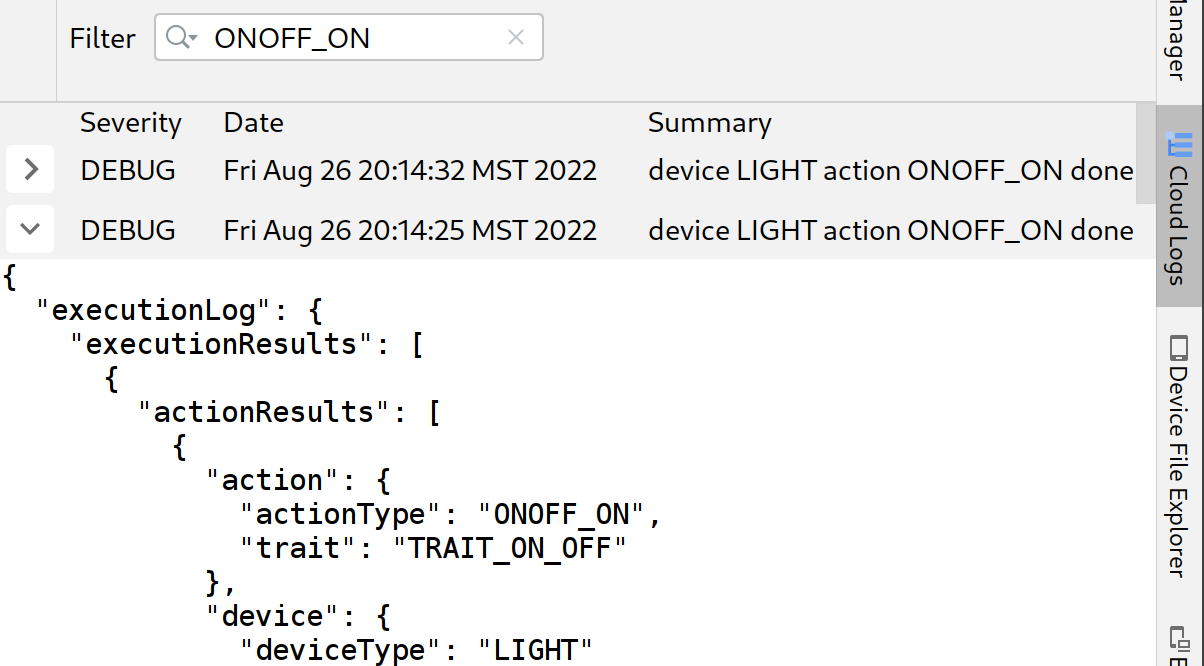
Click Fetch to submit your query parameters.
Once logs are loaded, click any record to expand the full JSON payload. Click again to display the full message.
Optionally, you can type a key word in the Filter box to narrow your log
results. Click the x to remove your filter and go back to the original
fetch results.
View Home Graph and Run Tests
To list your devices, select Home Graph from the Google Home Plugin panel.
Click Refresh to display the Device name, Device id, and Device type for your devices associated with the selected project. You can have multiple Google Home Graph panels open for separate projects.
Once your devices are loaded, click any record to expand the full JSON payload.
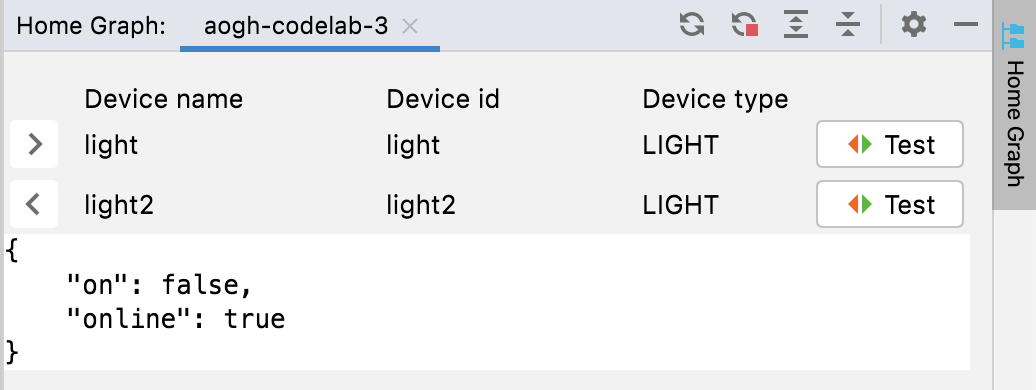
You can also use Expand and Collapse to display and hide the JSON payloads for your devices.

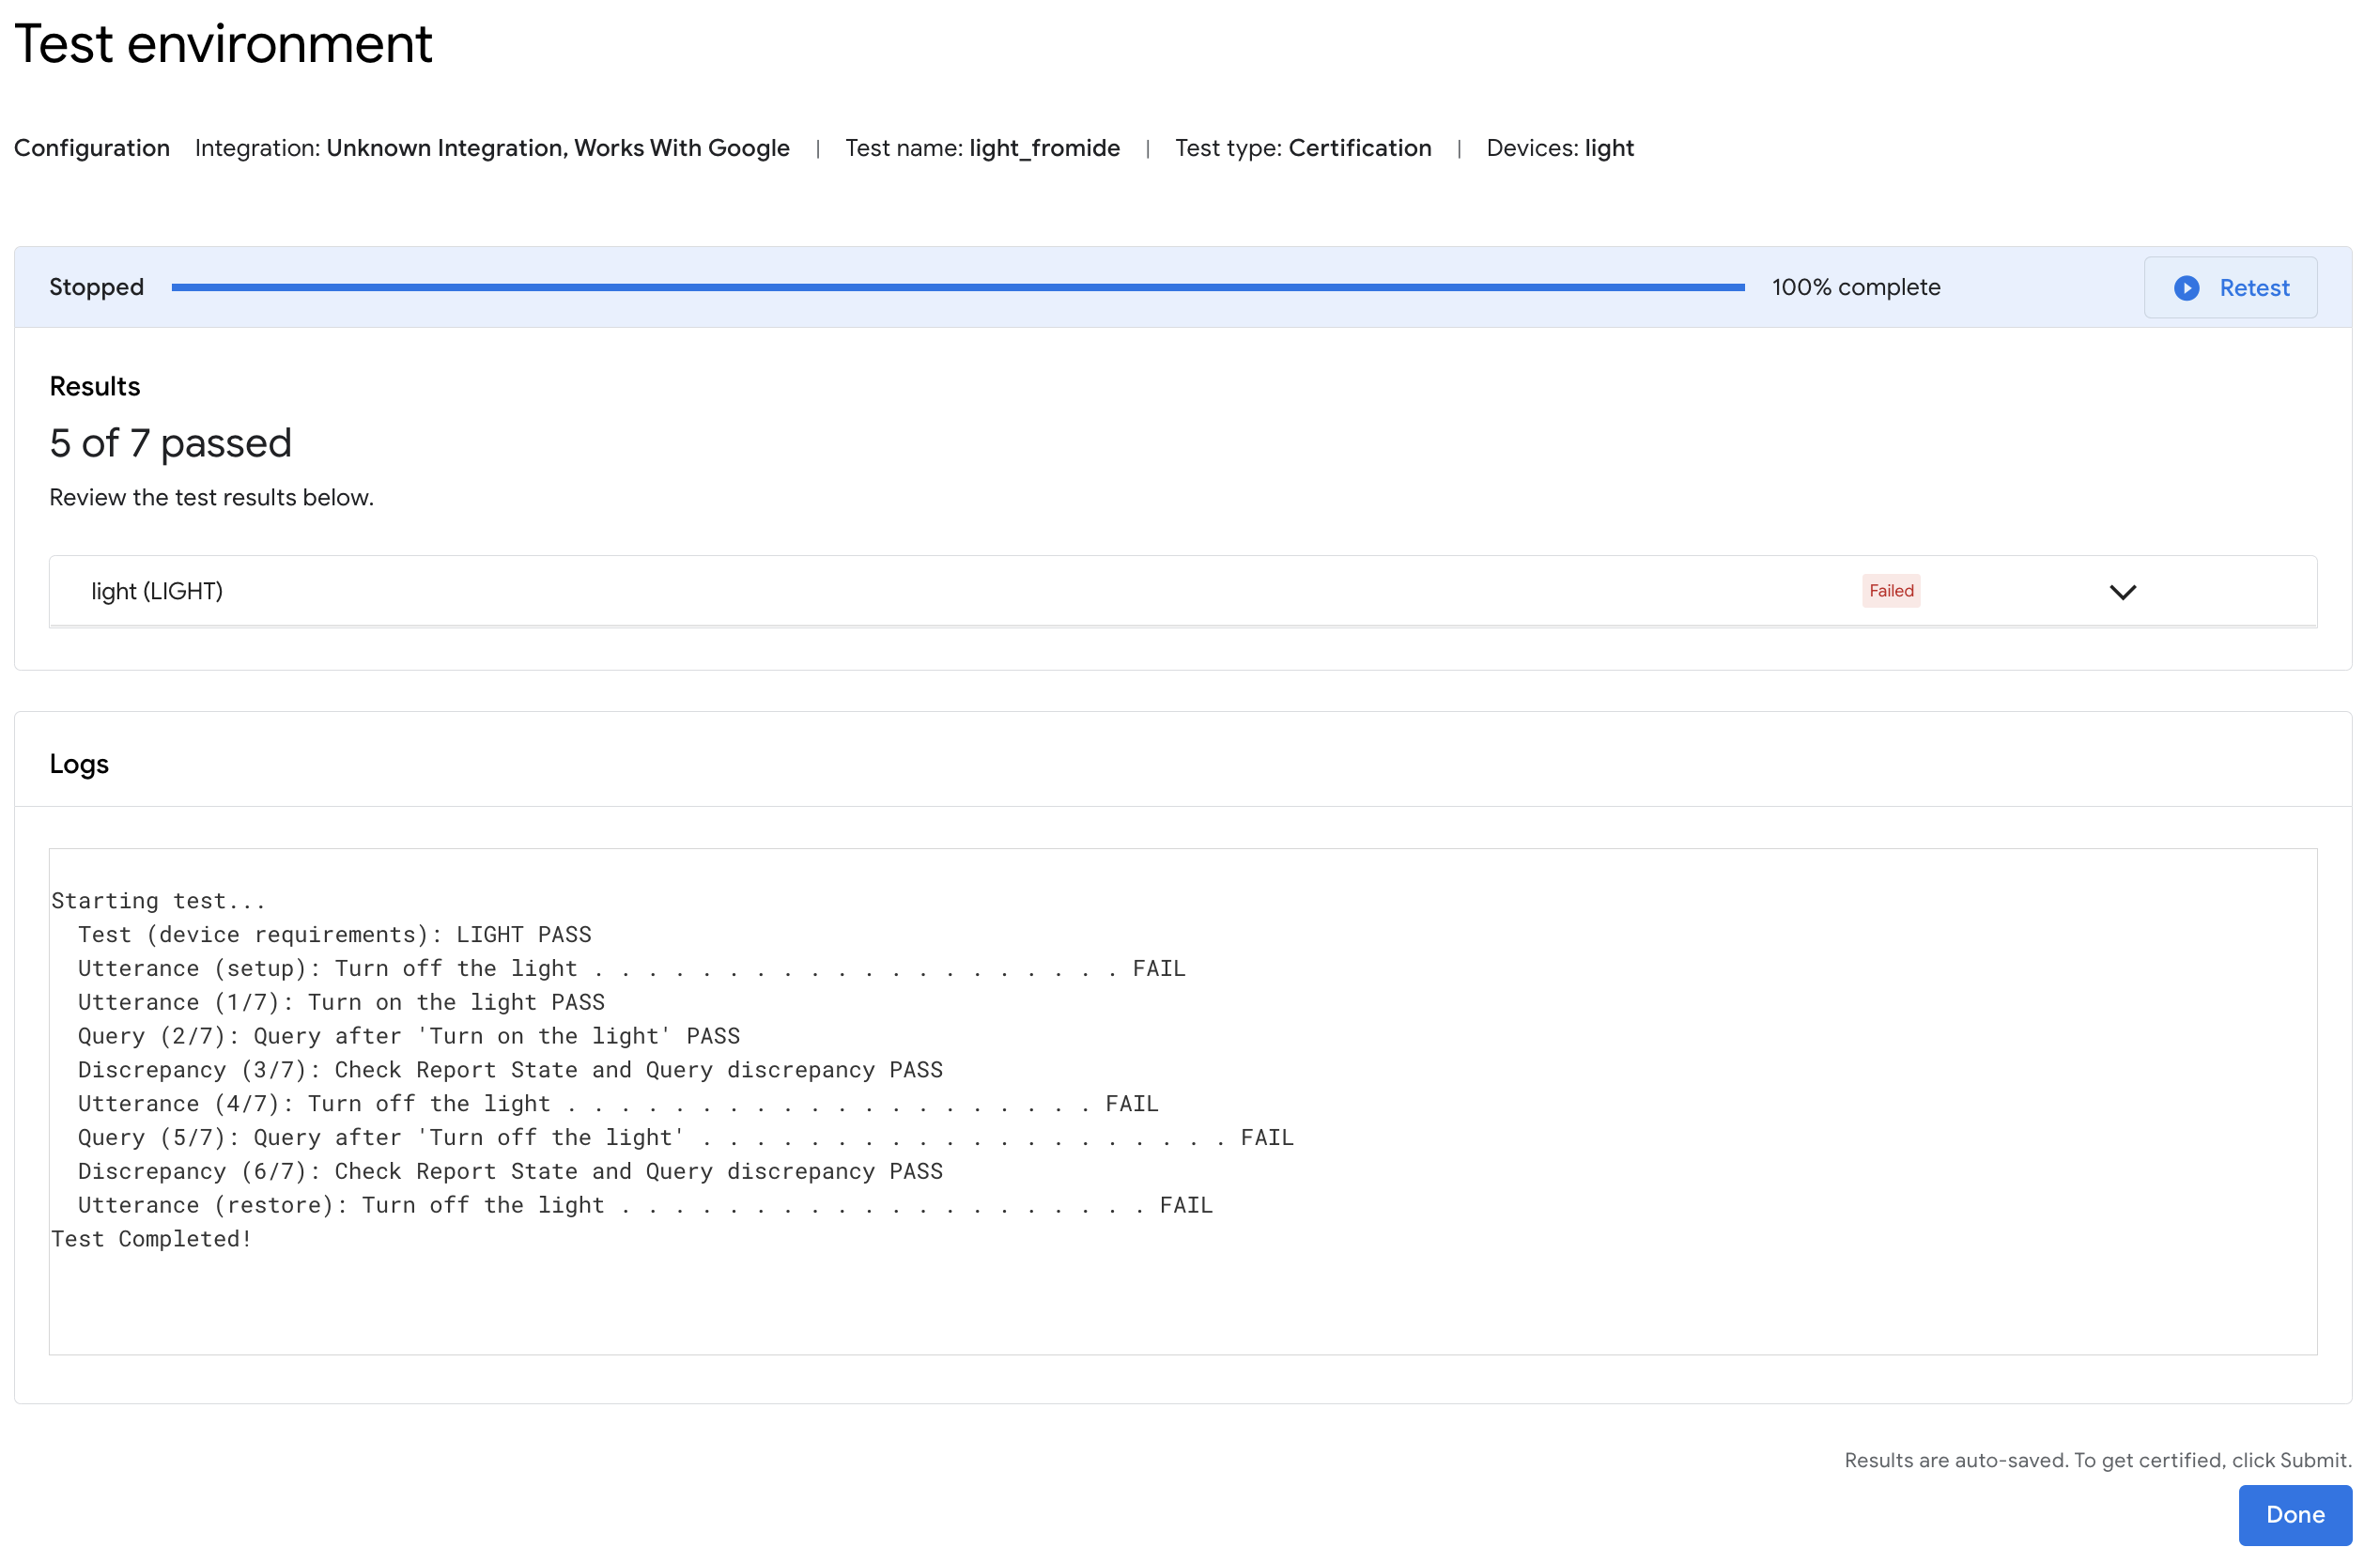
To launch the Test Suite for a specific device, click Test. This launches the Test Suite in your browser with your device selected and ready to test. Click Start and wait for the test results.
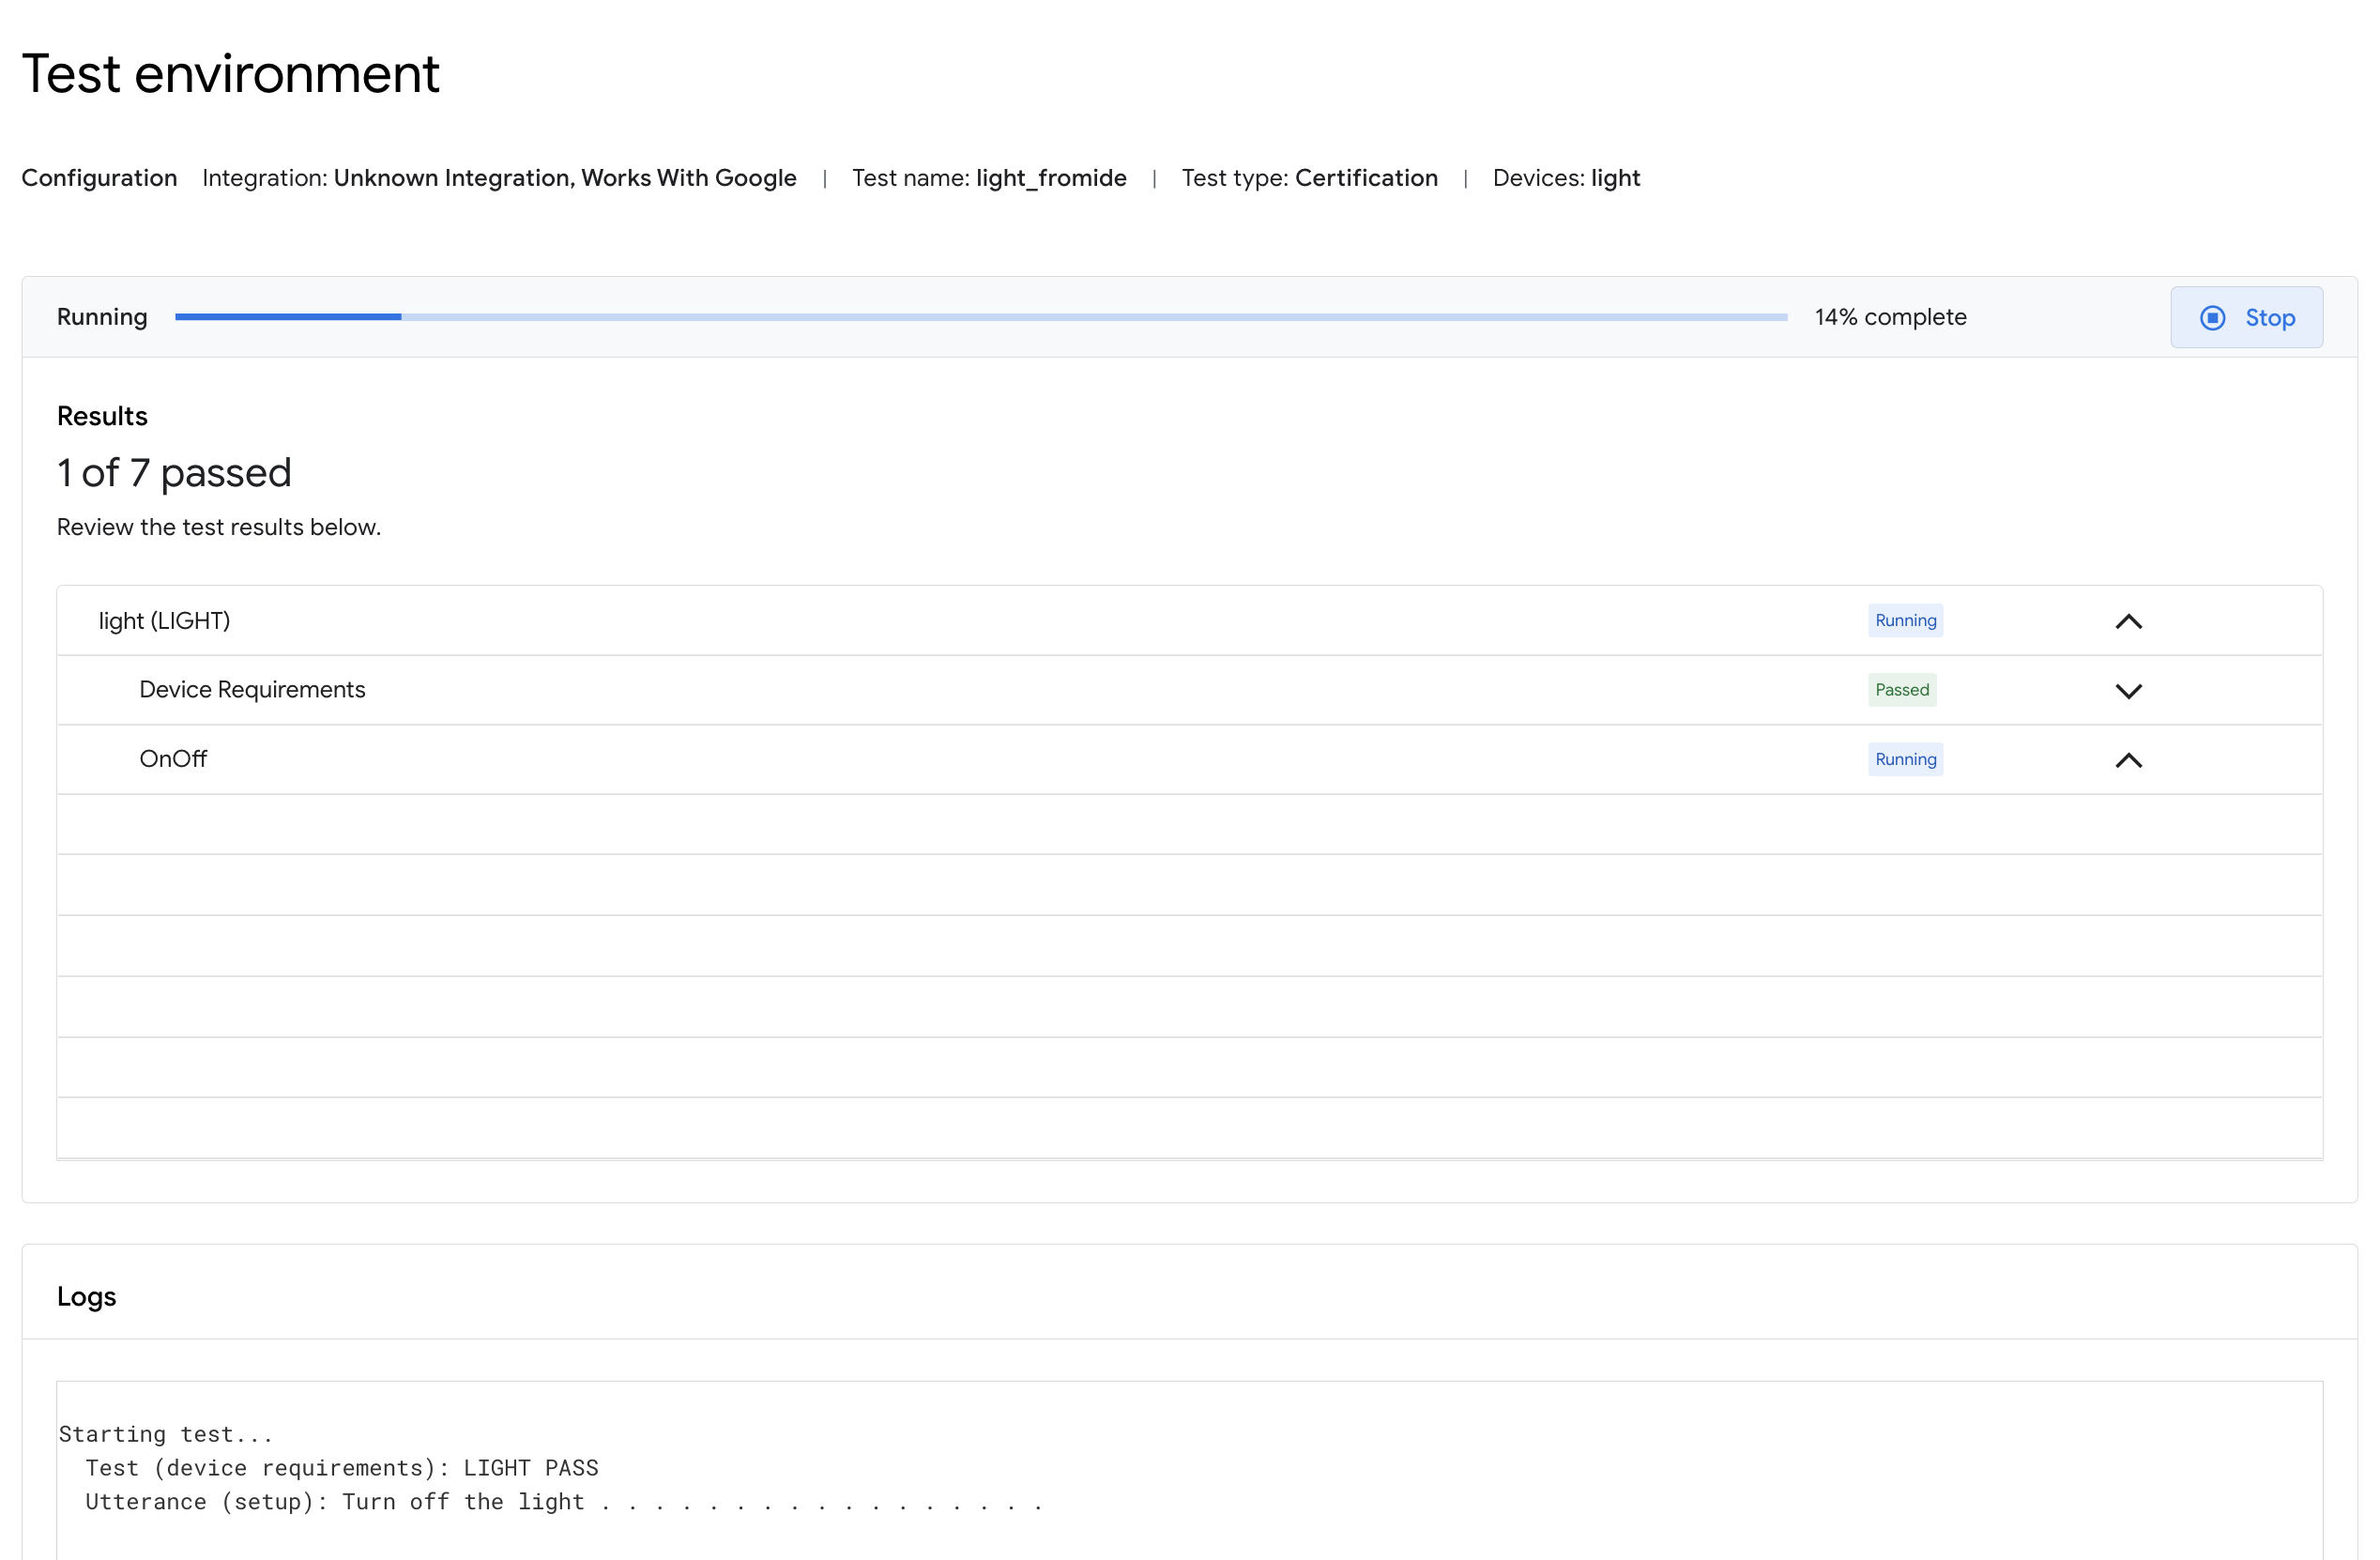
You can check the test details and view the logs once the tests complete.
Android Debug Bridge (adb) Log Viewer
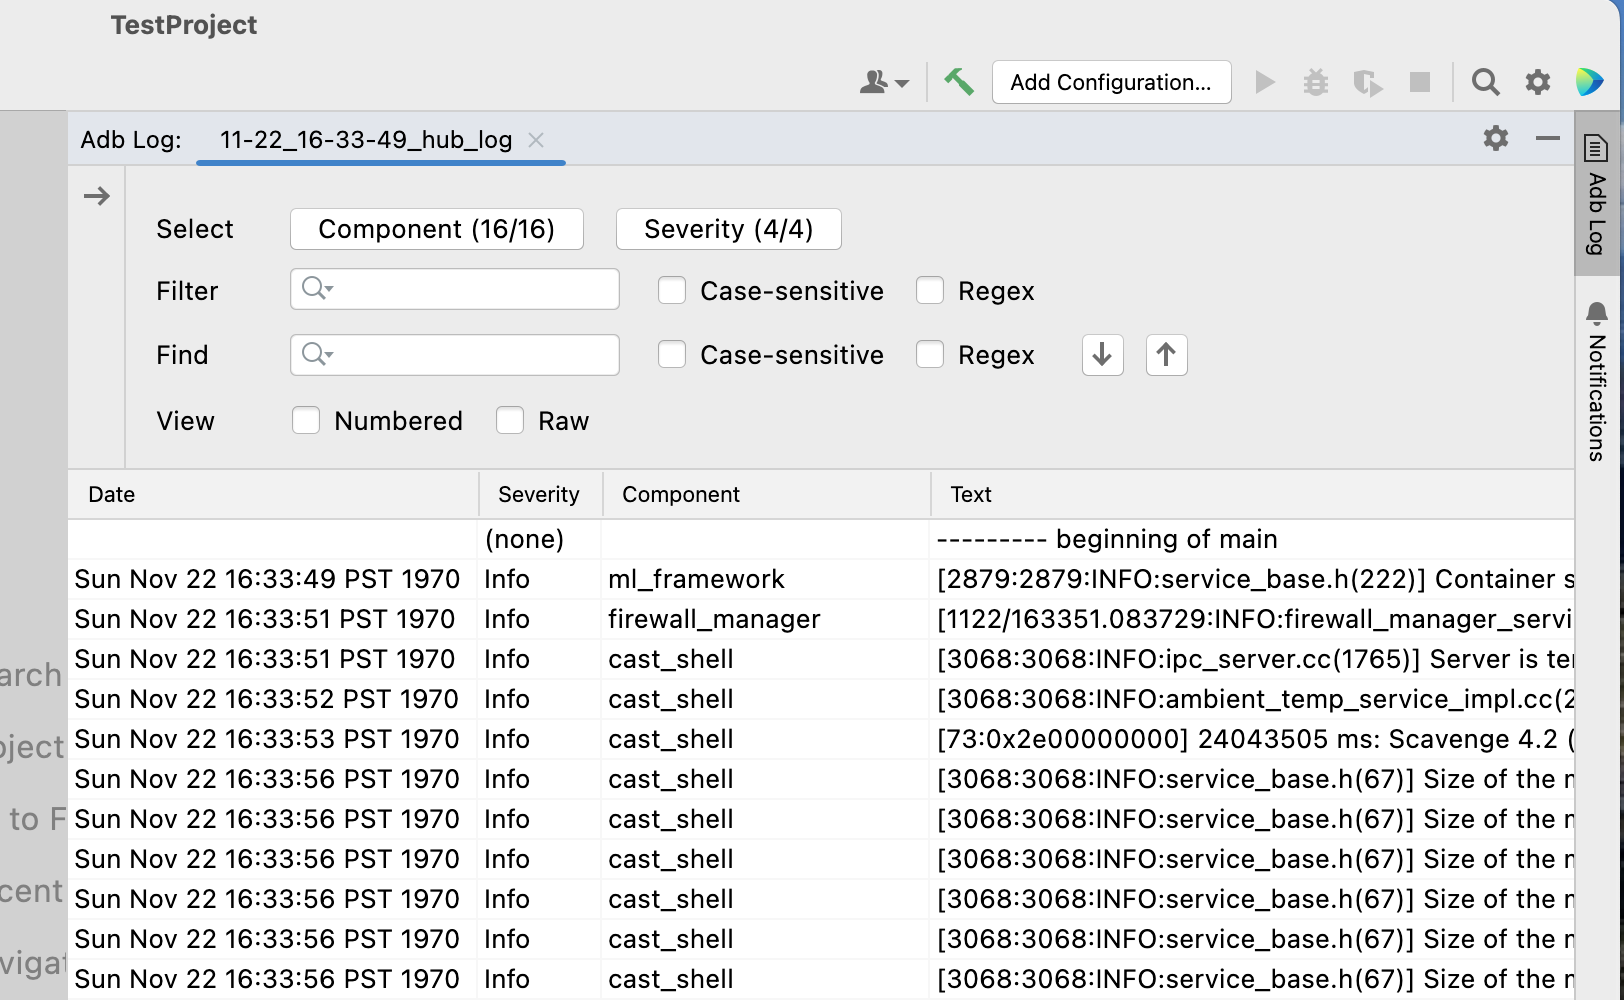
To open a project tab in the Adb Log tool window, click the Adb Log command in the Google Home plugin toolbar (on the left). You can open separate Adb Log tabs for each of your log files. To delete a tab, click the icon.
Use the Select field to select a specific logging component to view and the Severity drop-down to only display entries with the matching log severity.
For your selected adb log, you can filter log entries using the Filter field with optional Case-sensitive or Regex modifiers.
Additionally, you can:
- Find specific entries using the Find field and the Find Next ( icon) and Find Previous ( icon) commands.
- Use optional Case-sensitive or Regex modifiers.
- Jump to line to jump to a specified line (by number) in the log.
Select Numbered to view log lines with line numbers added. Select Raw to view raw log entries.
Resources and feedback
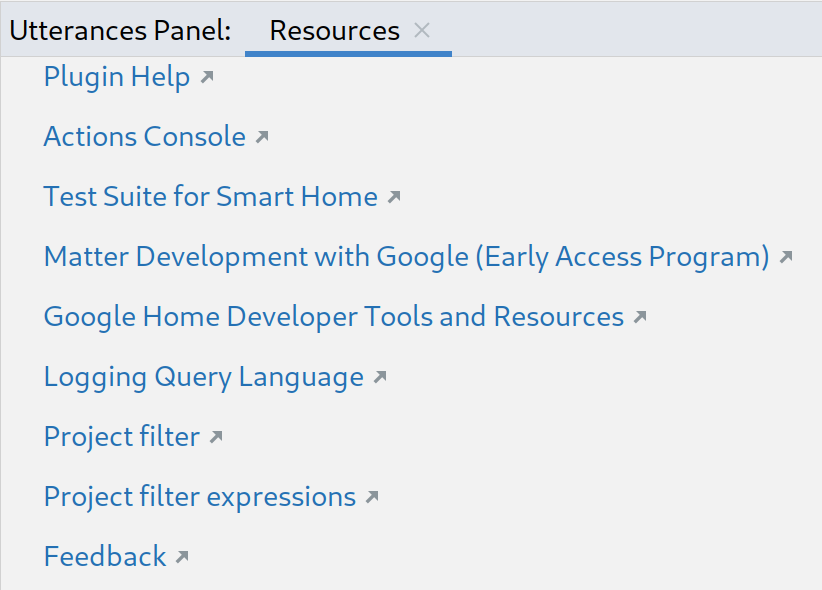
Click Resources for a list of developer tools and resources.
To submit your thoughts or feedback on how we can improve the development experience with the Google Home Plugin, click Feedback.