
1. Before you begin
Matter offers a seamless, cross-platform device setup and control experience for end users. This is mainly possible due to the multiple ecosystem components that work in conjunction with each other behind the scenes. Troubleshooting systems like these can often be daunting to new developers, so we developed a series of tools and techniques to make your life easier as a Matter developer with Google Home.
There are three main components for Matter that are covered in this codelab. For each of these systems, Google provides a set of troubleshooting analytics for developers collected from phones and hubs:
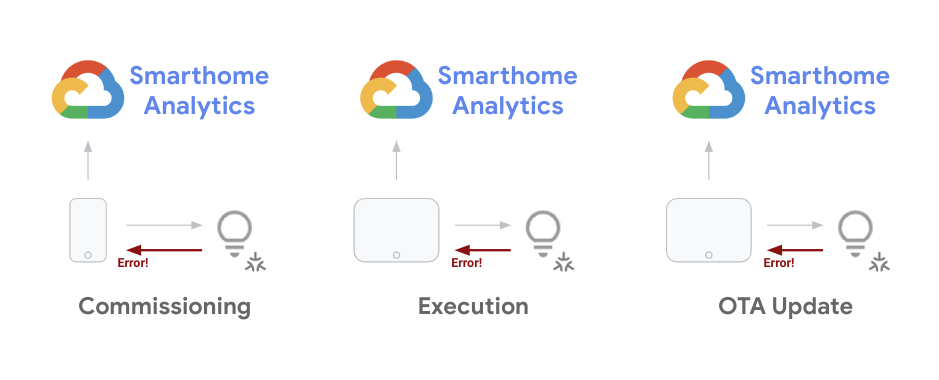
As a developer it is crucial for you to be able to mitigate issues you experience throughout the device development cycle. Once you launch your project, you need to monitor issue trends for devices out in the field in an aggregate manner, and fix them through software updates. This codelab covers techniques you can use for both of these purposes.
Prerequisites
- Complete Get started with Matter guide with a working Matter project and device setup
- Have an Android phone that you can connect to your workstation (for ADB logs)
What you'll learn
- How to use analytics tools for Smart Home to monitor Matter issues at scale.
- How to triage errors by accessing error logs and collecting information.
- How to access Matter documentation and support resources to seek help.
2. View Google Home Analytics
Monitoring performance is critical for a successful integration with the Google Home ecosystem. We provide a set of monitoring tools to smart home developers on the Google Cloud Platform. You can use these tools to get a measure of your project's performance.
Access project metrics
- The first step to access your data is to check the Google Home dashboards, by logging in to Google Cloud Console and navigating to Operations > Monitoring > Dashboards.
There are a number of dashboards available to your project (including other GCP products ). The dashboards provided for smart home come with a prefix of Google Home Analytics.
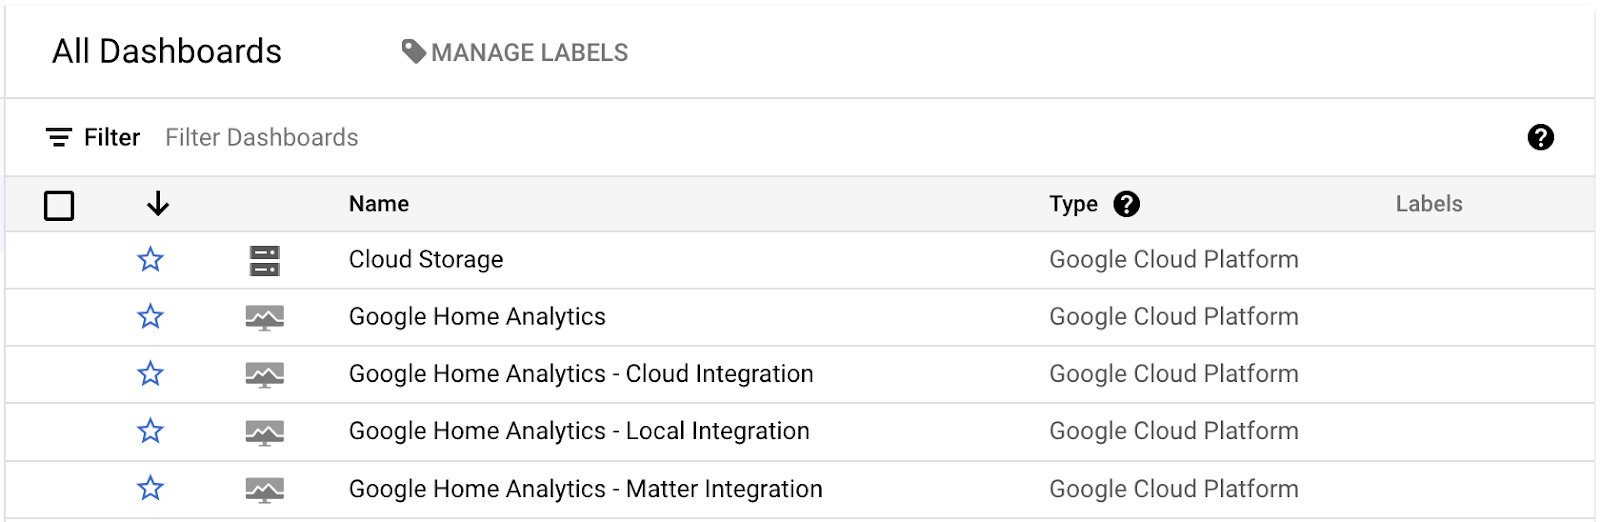
We currently have a general dashboard that covers your whole project, as well as dashboards for specific integration (Cloud, Local, Matter) or device types (Cameras). These dashboards only contain data if you have an integration of the corresponding type, along with a functioning project fulfilling requests.
When you open one of these dashboards, you will see a series of charts that look like the following:
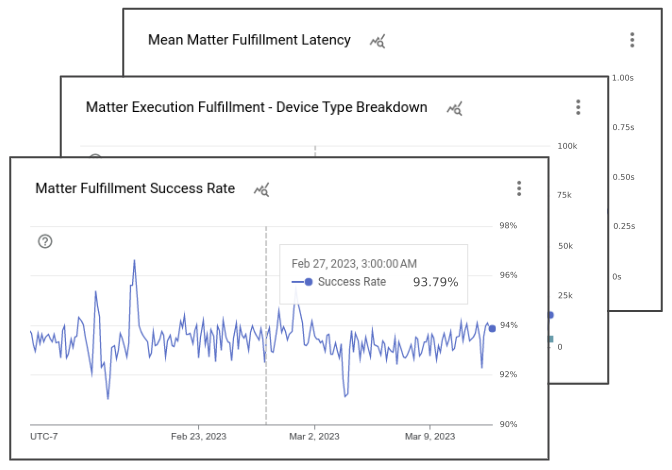
Google Home dashboards contain various charts that show details for the events associated with your project. With each integration dashboard, you see a chart showing the total number of requests handled by your project, a chart showing the success rate for that integration type, and several charts showing the device types and traits involved. Additionally, with Matter you have a set of charts that track the commissioning success, as well as the rollouts of updates on your devices.
Note that the default view with the charts you see in the Google Home Analytics dashboards is just a view we created for your project using smart home metrics data. You can also use the Metrics Explorer to create your own charts from the same underlying metrics and save them in your custom dashboards.
Access error logs
Logs Explorer is a collection of tools to work with event logs generated on a project. It is accessible in Google Cloud Console by navigating to Operations > Logging > Logs Explorer.
Once you open up the Logs Explorer you get a view that looks like the following:
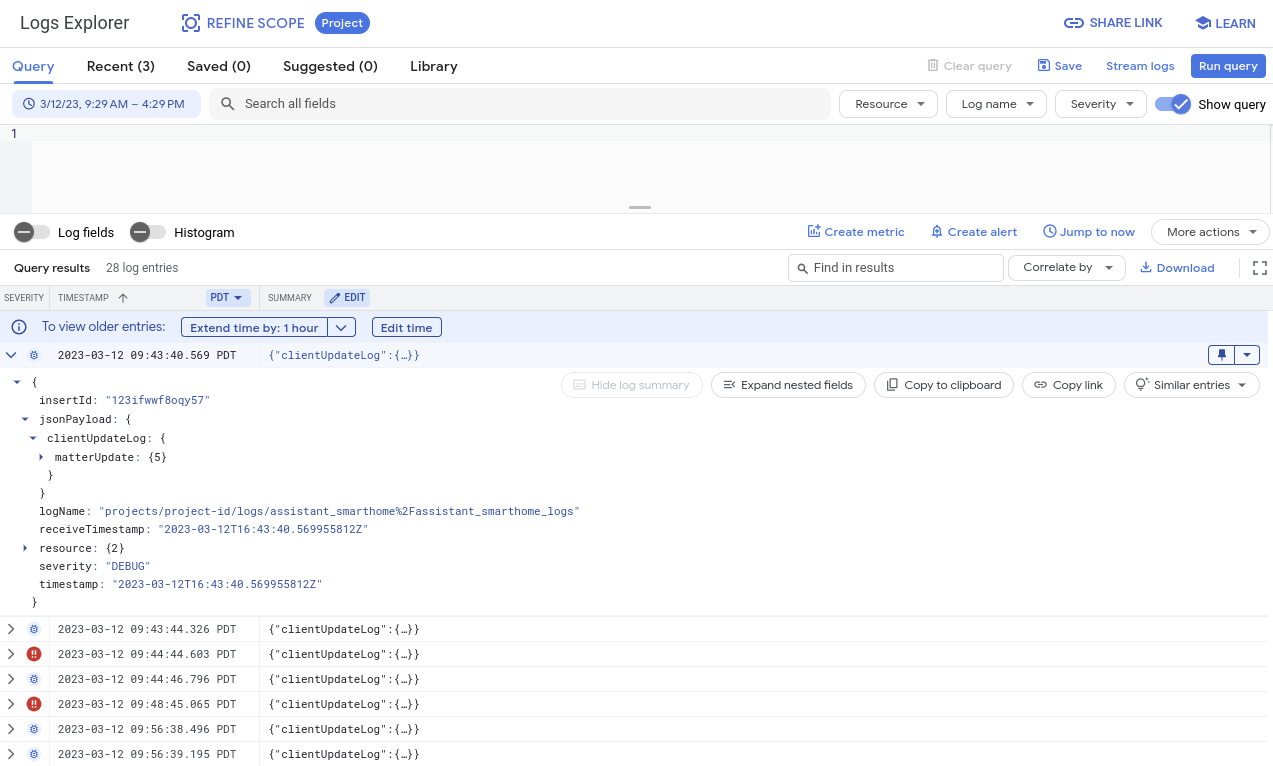
The explorer window contains various tools to view, filter, query, and analyze logs. By default, this view shows logs generated from all systems available to your project, including logs that are generated outside of Smart Home. That's why it's key to use these logs by filtering for events you want to debug. We will talk about this more in the debugging sections.
3. Debug Commissioning Issues
The first type of metric we will take a look at is about Matter commissioning events. Commissioning refers to the set of steps needed for a user to set up a Matter device for the first time.
During device commissioning, a set of interactions takes place between the Matter device, Google Home app, and the Matter fabric. The following image demonstrates some of these events:
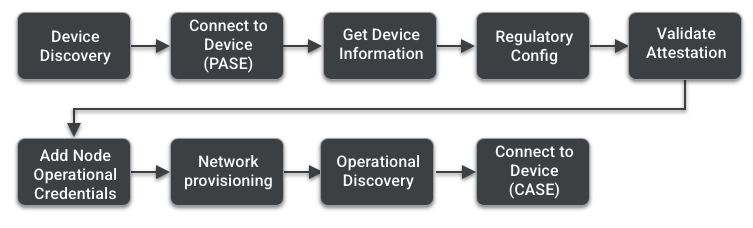
You can check the commissioning page from the Matter Primer to learn more about each of these steps. In this section we will cover the tools and techniques to debug commissioning issues.
Use Google Home Analytics
We have created a set of metrics for you to investigate commissioning issues by tracking events and understanding at which stage the errors might occur. You can find these in the Matter Integration Dashboard, as we covered in the previous section.
Charts in this dashboard provide data on device commissioning:
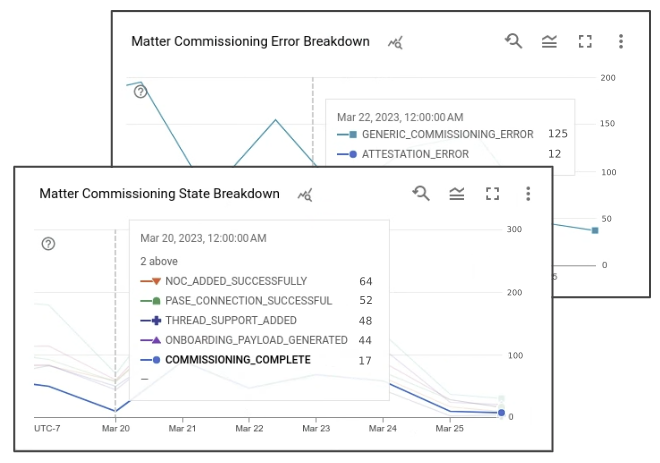
The device count chart shows the number of commissioning attempts by users on a given date. Success rate shows the perceived success rate for these events on Google's end. Each commissioning attempt generates a set of events with associated states. When an error happens at any of these states, it is also captured in the error breakdown chart.
Commissioning States:
- COMMISSIONING_STARTED
- ONBOARDING_PAYLOAD_GENERATED
- LOCAL_DISCOVERY_SUCCESSFUL
- PASE_CONNECTION_SUCCESSFUL
- NOC_ADDED_SUCCESSFULLY
- COMMISSIONING_COMPLETE
To view a detailed version of these events, go to Operations > Logging > Logs Explorer. To filter for commissioning errors, you can search for "clientUpdateLog" coupled with "severity>=ERROR" in the query field.
A commissioning error log for Matter looks like this:
{
  "insertId": "1a32ry0f6xpzzn",
  "jsonPayload": {
    "clientUpdateLog": {
      "MatterUpdate": {
        "reportedProductId": 55,
        "sessionId": "1584879052892229997",
        "reportedVendorId": 4800,
        "commissioningState": "GENERIC_COMMISSIONING_ERROR",
        "status": "GENERIC_ERROR"
      }
    }
  },
  "resource": {
    "type": "assistant_action_project",
    "labels": {
      "project_id": "<project-id>"
    }
  },
  "timestamp": "2023-03-01T07:09:55.216425297Z",
  "severity": "ERROR",
  "logName": "projects/<project-id>/logs/assistant_smarthome%2Fassistant_smarthome_logs",
  "receiveTimestamp": "2023-03-01T07:09:55.216425297Z"
}
In addition to the commissioning state and a status code, an error log contains timestamps for the captured error, as well as the Matter Product ID that allows you to identify which of your products caused the error. The set of logs generated from the same commissioning attempt share a sessionId.
Using metrics from Google Home Analytics gives you an initial idea at which stage the issue might take place. To find the root cause for device commissioning errors, sometimes you might need to do additional debugging using the logs generated by the mobile device used in the commissioning process. For these, you need the Android Debug Bridge.
Use the Android Debug Bridge (ADB)
Another way to troubleshoot commissioning issues is to use the Android Debug Bridge (ADB) command line tool. Since commissioning is mainly handled between the mobile device and the Matter device, it's possible to use the ADB tool to access logs generated by the Google Home app throughout commissioning.
Install platform tools
ADB comes as part of the Android SDK Platform Tools, which can be installed with Android Studio or through the sdkmanager command line tool.
Once you have successfully installed platform tools on your system, verify ADB by checking the version number from the terminal with the following command:
$ adb -- version
This should display the version number of the installed ADB utility without any errors.
Enable USB debugging
Next is to enable USB debugging on your Android device.
First follow the steps to enable developer options on your device, and then enable USB debugging.
This allows ADB to access logs generated by apps currently running on the device.
Retrieve device ID
- Run the ADB server with the following command:
$ adb start-server
- Connect your phone to the computer running the ADB server.
You might get a warning message on your phone about USB debugging, asking if you want to allow your computer to access information from your phone:
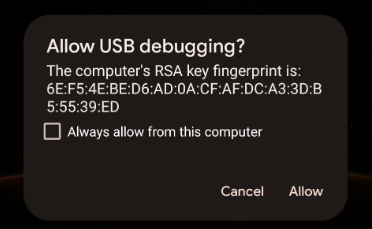
- If you get this warning message, click Allow.
- Issue a list devices command from terminal to see if your computer can access the phone through ADB, using the following command:
$ adb devices
This should give a response similar to this:
List of devices attached
<phone-id>    device
Your <phone-id> is an alphanumeric string that uniquely identifies your device.
- Remember the
<phone-id>value for use in the next steps.
Collect system information
Next is to check the version information of the apps and the system on your device.
- To check Android OS version:
$ adb -s <phone-id> shell getprop ro.build.version.release
- To check Google Home App version:
$ adb -s <phone-id> shell dumpsys package com.google.android.apps.chromecast.app | grep versionName
- To check Google Play Services version:
$ adb -s <phone-id> shell dumpsys package com.google.android.gms | grep "versionName"
- To check if you have the Home / Matter control modules through Play Services:
$ adb -s <phone-id> shell dumpsys activity provider com.google.android.gms.chimera.container.GmsModuleProvider | grep "com.google.android.gms.home"
Make sure these return values are supported by our ecosystem. When reaching out for support on commissioning failures, please always include system information in your support tickets.
Collect error logs
Next, start the log collection process, then go through the commissioning steps to generate the error events you want to debug.
- Run the following command by providing your
<phone-id>, as well as a<file-name>where the logs will be saved in your computer (eg.debug_file.txt).
$ adb -s <phone-id> logcat > <file-name>
This immediately starts the logging process. A file with the provided name is created if it doesn't already exist, and logs from the phone are added to the file after each event.
Go ahead with the commissioning steps with your Matter device.
- Once you get to the error you want to debug, stop the logging by pressing
Control+Cin the running terminal window.
Your logs should now be stored in the <file-name> logging file. Since this process records logs from every running process tracked in the device, there will be a lot of logs in this file. That's why you should always utilize these logs by searching the entries you need.
Analyze error logs
Commissioning processes are handled through a subsystem called MatterCommissioner within GHA.
- Following the main strategy used when analyzing commissioning errors, look for errors generated by the MatterCommissioner subsystem with the following command:
$ grep "MatterCommissioner" <file-name>
This generates an output containing the events from the commissioning process.
- If your Matter device is using Thread, you can also look for errors generated by the Thread subsystem through the following command:
$ grep -E "(ThreadNetworkManager|BorderAgentScannerImpl|ThreadBrSynchronizer)" <file-name>
As you analyze the log file generated by the ADB debugging process, look for certain patterns as well. A lot of commissioning errors include the "commissioning failure" string in its error message.
- Search for a commissioning failure message with the following command:
$ grep "SetupDevice" $phonelog | grep -A 20 "Commissioning failed"
4. Debug Device Control Issues
Once users set up and commission Matter devices into the Google Home ecosystem, they can issue commands by voice using Google Assistant (for example, "Ok Google, turn on the lights in my living room") or by using the UI on the Home App or the Google Nest display devices.
As the control specification between end devices and Google Hubs are mediated by Matter, it is expected to have fewer errors on the device control side. Regardless, we provide metrics and logs for you to debug these types of issues as well.
Use metrics
In the Matter Integration Dashboard you will see several metrics regarding device control. There are three charts critical for assessing the performance of your devices out in the field:
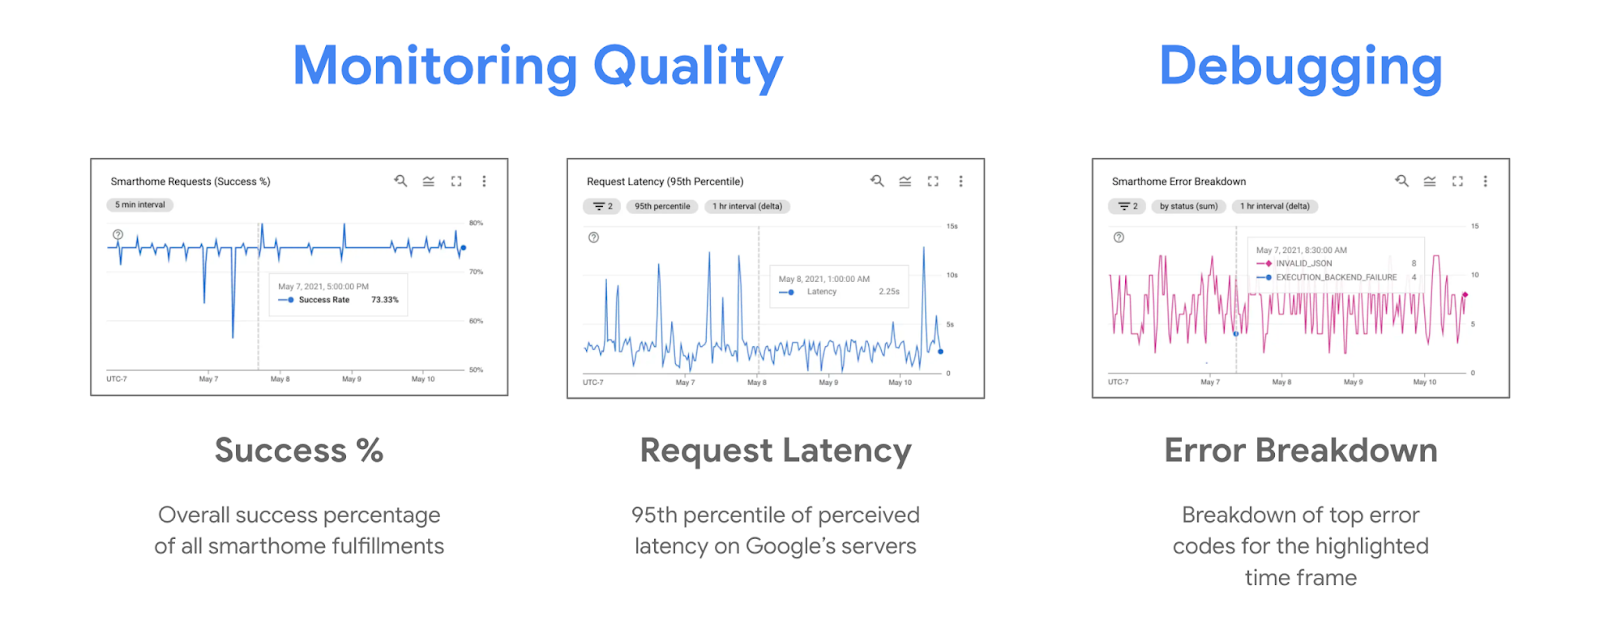
During control issues you commonly see downtrends in the success percentage and an uptrend in the error breakdown chart. The error breakdown chart shows you the errors captured by Google Nest Hubs regarding why the device control attempt has failed.
Use logs
Each Matter device control issue also generates an error log in the system. These errors can be filtered from the Logs Explorer by searching for "executionLog".
Matter device control error logs look like the following:
{
  "insertId": "1a32ry0f6xpzzn",
  "jsonPayload": {
    "executionLog": {
      "executionResults": [
        {
          "executionType": "MATTER",
          "latencyMsec": "6000",
          "actionResults": [
            {
              "action": {
                "actionType": "ONOFF_OFF",
                "trait": "TRAIT_ON_OFF"
              },
              "status": {
                "externalDebugString": "No message was received before the deadline.",
                "statusType": "RESPONSE_TIMEOUT",
                "fallbackToCloud": false,
                "isSuccess": false
              },
              "device": {
                "deviceType": "OUTLET"
              }
            }
          ],
          "requestId": "1487232799486580805"
        }
      ]
    },
    "locale": "en-US"
  },
  "resource": {
    "type": "assistant_action_project",
    "labels": {
      "project_id": "<project-id>"
    }
  },
  "timestamp": "2023-03-01T15:47:27.311673018Z",
  "severity": "ERROR",
  "logName": "projects/<project-id>/logs/assistant_smarthome%2Fassistant_smarthome_logs",
  "receiveTimestamp": "2023-03-01T15:47:27.311673018Z"
}
Each error log contains a timestamp, device type, and trait, as well as the error associated with the control request in the statusType. Many control errors also include an externalDebugString, a short error message that explains what the error is about.
5. Debug Other Features
So far you learned how to handle device commissioning and control issues for Matter. There are also other features within the ecosystem that you can use or recommended techniques to ensure a good quality integration.
Track OTA updates
To track the releases for Over-the-air (OTA) updates to Matter devices issued by Google Home, we provide a set of metrics that show the hardware and software versions for the devices out in the field.
Once you issue an update from the console, keep an eye on the following metrics:
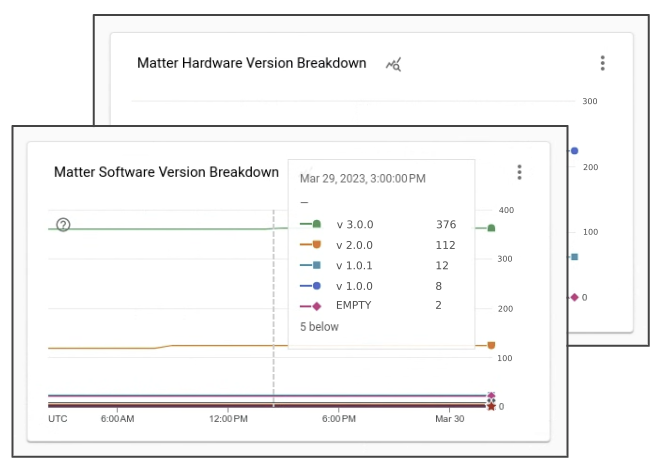
You will see that in the days following the release, more and more devices in the field get the new software version associated with your OTA software release.
6. Seek Support
Google provides tools and documentation for you to debug your Matter issues, but as the Matter ecosystem is new, there will be issues that these resources don't cover. For these cases, you can always reach out to us or the community to seek support.
Visit developer channels
There are three developer channels actively monitored within Google:

While each of these channels are monitored by the same team in a periodic manner, there are some key differences as to when to use which one.
- Stack Overflow: You can reach out to us and the Smart Home developer community with implementation questions or for seeking guidance. This channel is best for asking how to troubleshoot issues or implement a certain feature.
- Issue Tracker: This is the official Google-run issue tracker system, where external audiences can report errors on the ecosystem. It provides web tools to attach files and share sensitive info when needed. Using Issue Tracker is the best for reporting ecosystem issues or sharing feature requests.
- Developer Forum: In order to seek guidance from official Google support and community experts, you can reach out through the Nest Developer Forum. This forum is best for \ getting official guidance for development.
Sign up for the developer newsletter
Besides visiting the developer channels for questions, we also release a quarterly newsletter that highlights new features and provides the news on the state of the Google Smart Home ecosystem.
You can use the sign-up form to receive the developer newsletter.
7. Congratulations
Congratulations! You successfully learned how to debug Matter integrations using the tools and techniques we recommend. We wish you a good time building Matter integrations with Google Home.
Next steps
Try the following exercises and explore additional resources:
- Besides using analytics to troubleshoot issues, you can also use Test Suite to test your integration against any potential issues.
- Once your integration is ready to share with the world, the next step is to get your project WWGH Certified. For this you can follow the steps in the Certification page.