
1. Before you begin
As we have covered in Debugging the Smart Home codelab, we are publishing metrics and logs to your Smart Home projects. Metrics help you to determine where your Smart Home Action is having trouble, and logs are useful when making a deep dive to solve these problems.
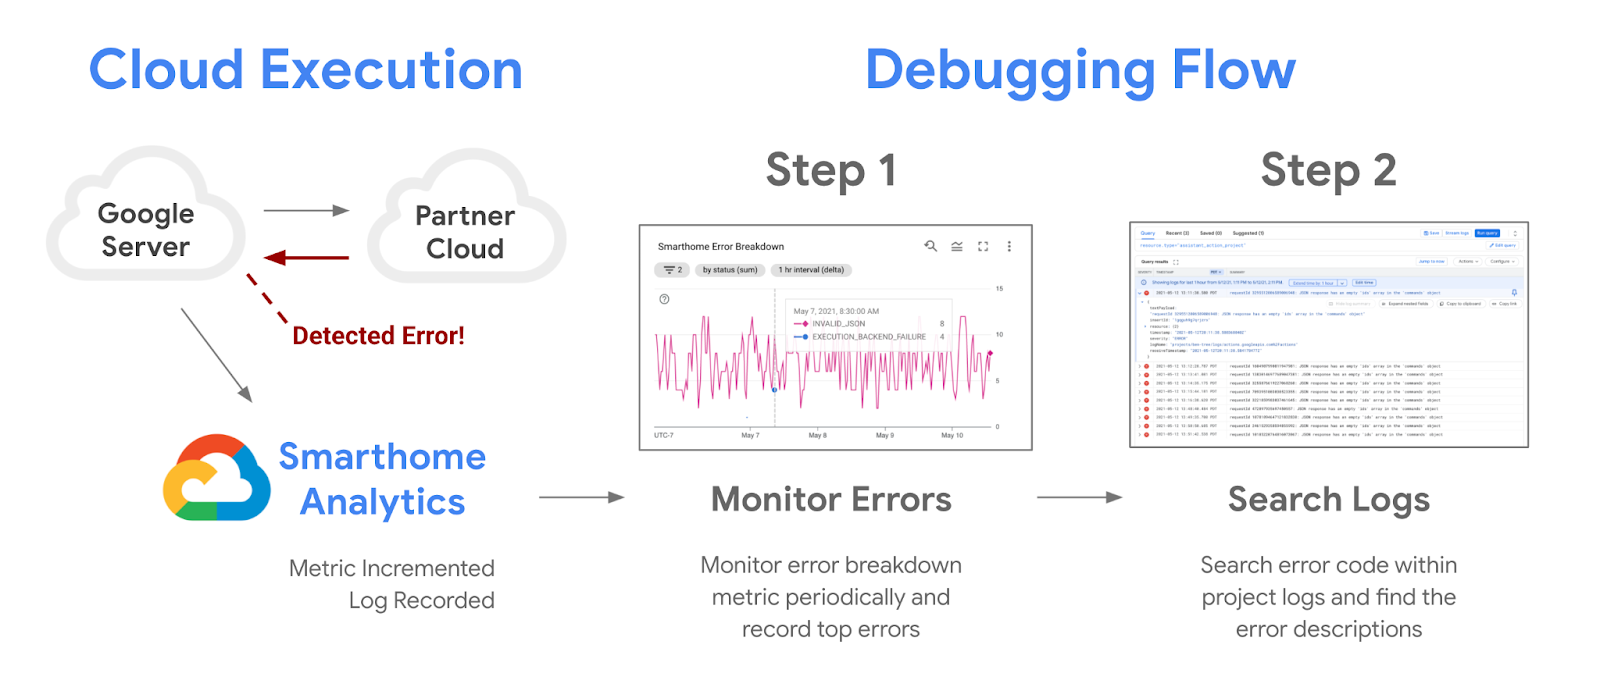
You can set up alerts using the metrics provided to your project to monitor outages in an automated fashion and to get notifications during service disruptions. We are publishing a confidence metric to highlight the disruptions with your project, which we will cover in this codelab alongside all the other alerting tools available to you on Google Cloud.
Prerequisites
- Have a Works with Smart Home Integration.
- Complete Debugging the Smart Home codelab.
What you'll learn
- How to monitor performance issues and service disruptions on your project.
- How to create a threshold based alert and receive notifications during disruptions.
- How to utilize the confidence metric provided to your project to detect outages.
2. Monitoring Performance
Monitoring performance is critical for a successful integration with Google Home Ecosystem. We are providing a set of monitoring tools to smart home developers on Google Cloud. You can use these tools to get a sense of your project's performance.
Accessing Dashboards
The first step to access your data is to check Google Home dashboards, by logging in to Google Cloud Console and navigating to Operations > Monitoring > Dashboards. You will see that there are a number of dashboards available, and the dashboards for smart home come with a prefix of Google Home Analytics.
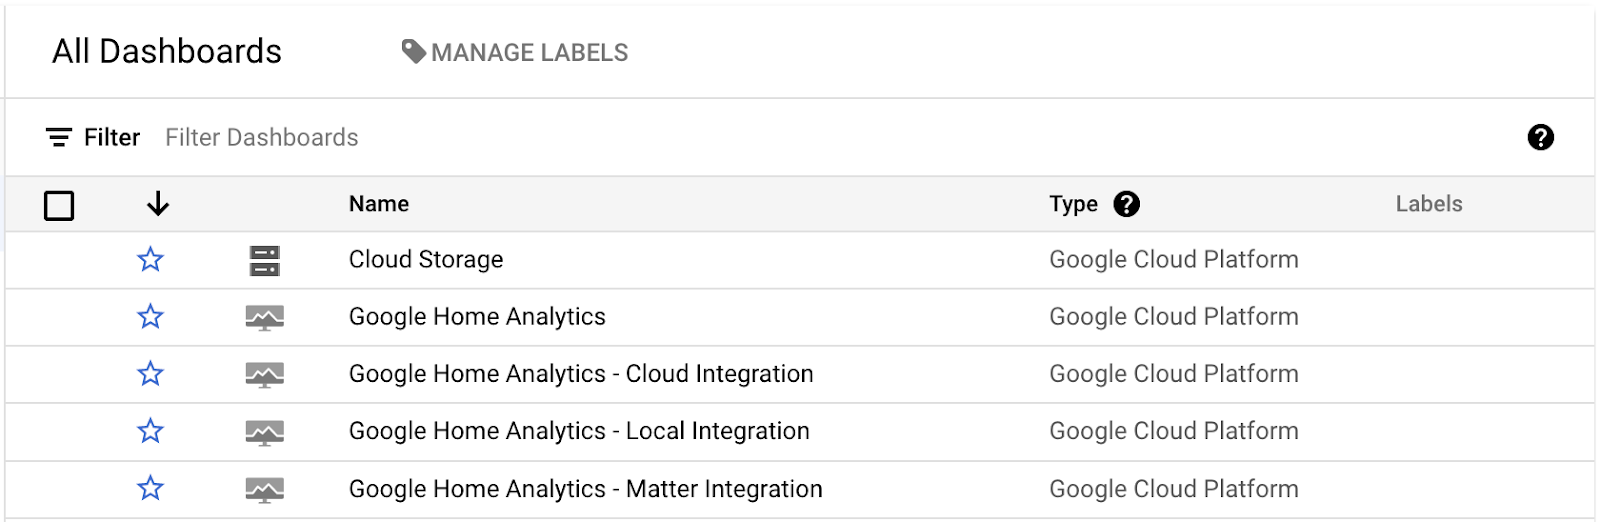
We created individual dashboards to represent each integration type. Cloud, Local, and Matter integrations have their own dashboard and the data for camera streaming protocols are provided in the Camera Quality dashboard. These dashboards will only contain data if you have an integration of the corresponding type, along with a functioning project fulfilling requests.
When you open up one of these dashboards, the view you get will look like the following:
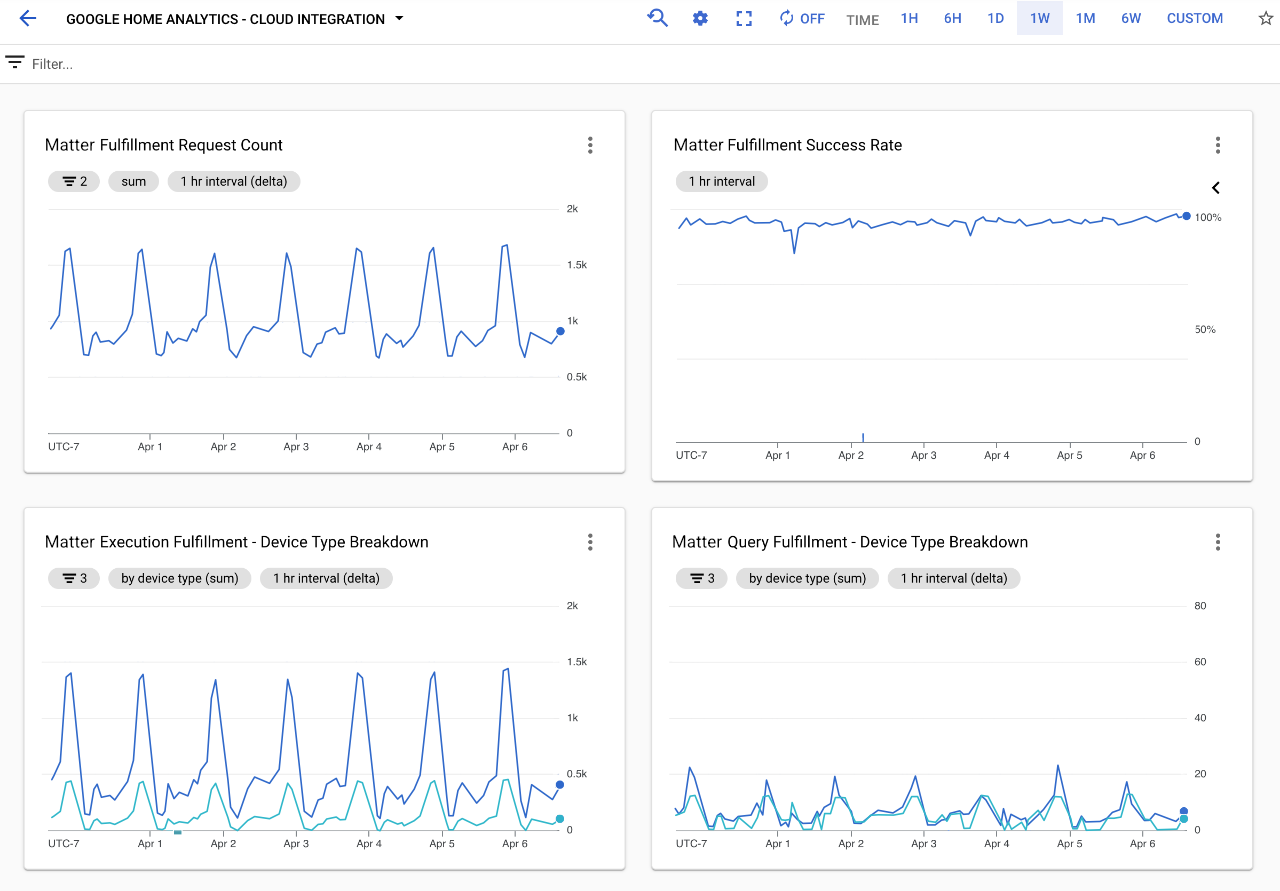
Dashboards contain various charts that show the details of the requests handled by your project. With every integration dashboard, you will see a chart showing the total number of requests handled by your project, a chart showing the success rate for that integration type, and several charts showing the device types and traits involved.
There are three charts that are critical to assessing the performance of your Smart Home actions:
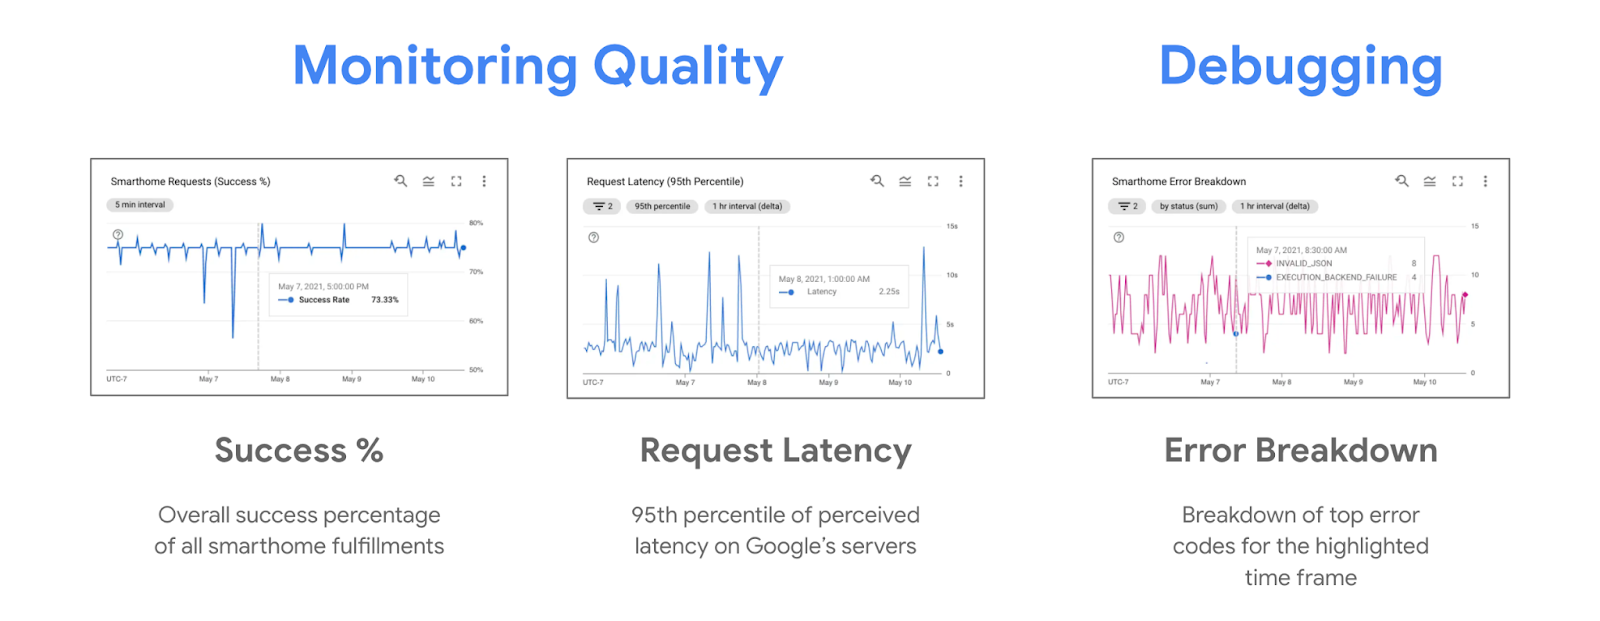
During outages you'll commonly see downtrends in the success percentage and an uptrend in the error breakdown chart. Monitoring the execution success percentage helps to notice the outage, while taking a look at the top errors in the error breakdown can help with debugging. You might also observe an uptrend in latency during outages, which you can see in the request latency charts.
Note that the default view with charts you see in Google Home Analytics dashboards is just a view we created for your project using smart home metrics data. You can also use Metrics Explorer to create your own charts from the same underlying metrics and save them in your custom dashboards.
Metrics Explorer
Metrics Explorer is a tool to visualize cross-sections of your project's dataset. The tool is accessible in Google Cloud Console by navigating to Operations > Monitoring > Metrics Explorer.
Google Cloud provides many different metrics out of the box, including some not related to smart home. Metrics we provide for smart home are listed under "actions.googleapis.com/smarthome_action/..." resource, and can be easily searched for by typing "smarthome" in the metric selection box.
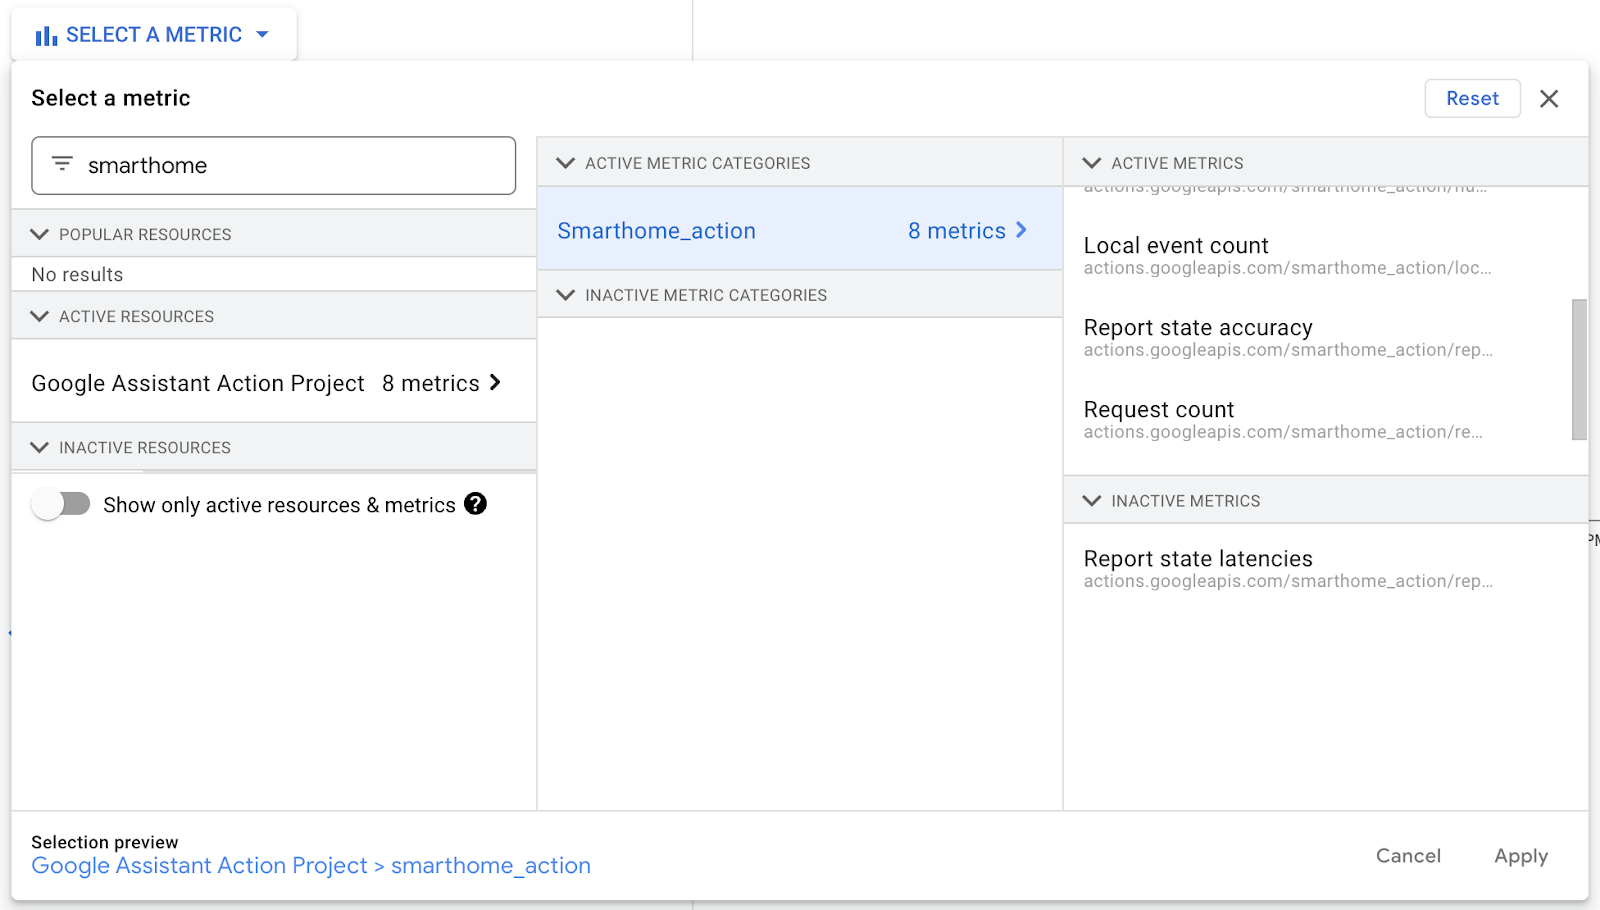
Searching for "smarthome" will bring up all smart home metrics we provide to your project. You can get detailed information on each of our metrics in the Monitoring and Logging pages of our documentation.
When it comes to monitoring your project, the simplest metric to refer to would be the Request count metric (which is a delta metric). This metric records an entry for each smart home execution initiated by your users and records fields like device type, trait, execution type involved with the execution, and the status field that shows the outcome.
Selecting this metric will produce a screen showing each data bucket similar to the following:
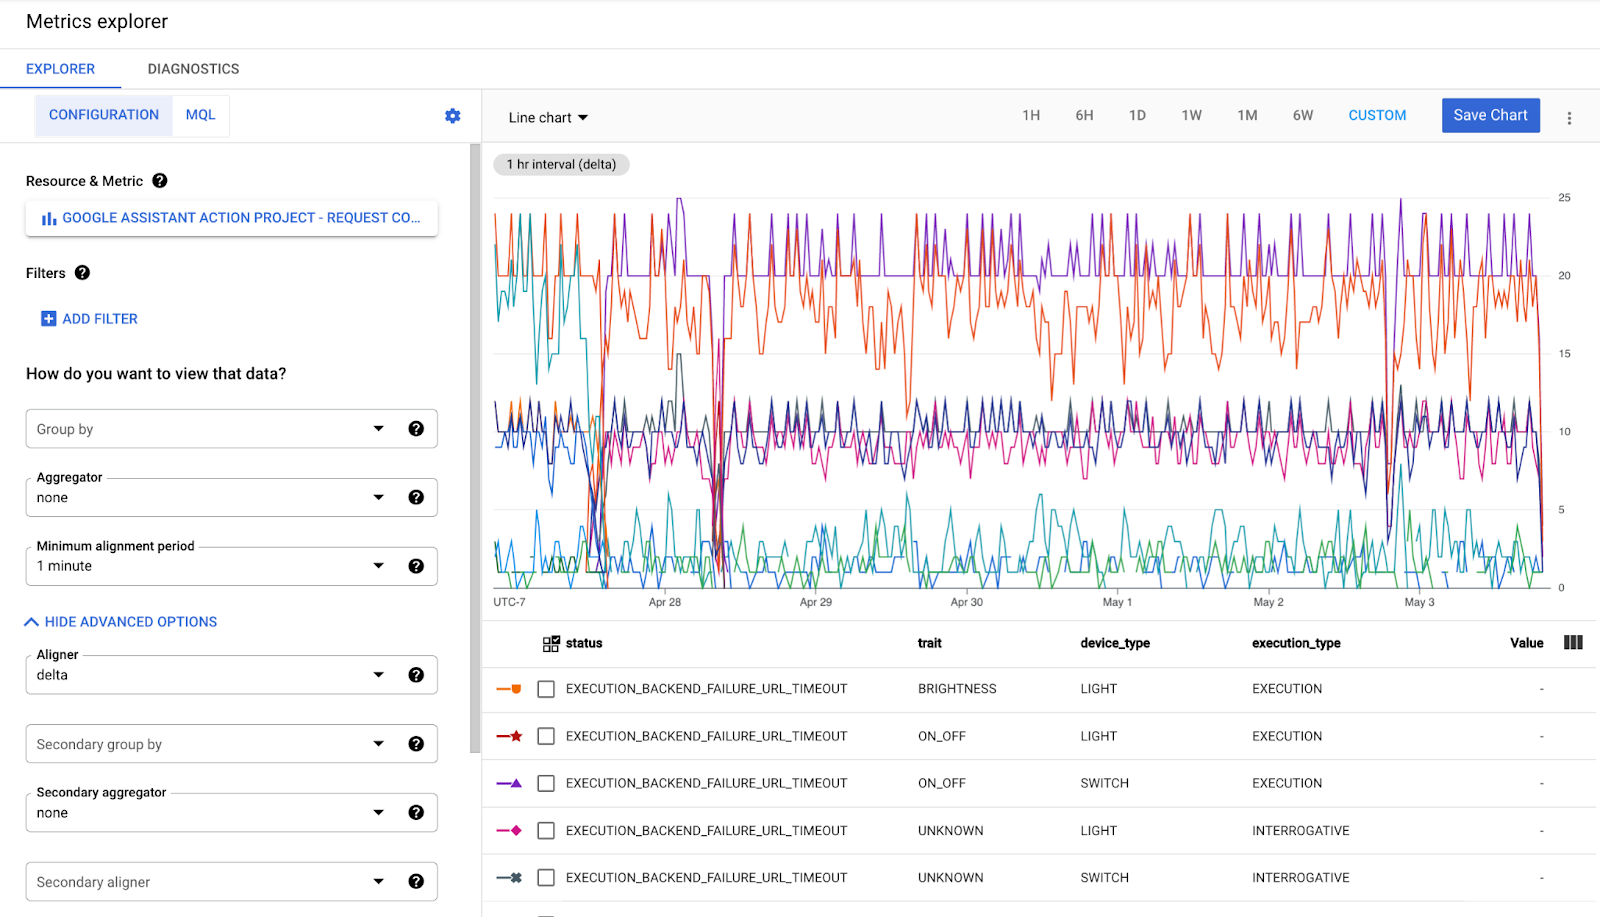
Essentially, for every combination of data labels present in this metric a bucket exists that records the change (delta) between the previous and current time intervals. It is possible to group, or filter out these buckets to get a desired view data slice you are after. Moreover, the data is aligned into selected time intervals with an alignment function (DELTA, MEAN, MEDIAN, SUM). Unless otherwise needed, you'll typically use the Delta alignment with a delta metric.
You can create most of the charts available in Google Home Analytics dashboards using Metrics Explorer and save your charts for later access in a custom dashboard. To achieve more complex views, such as a ratio chart, you will need to use MQL - Monitoring Query Language.
3. Success Metrics
When it comes to tracking your integration success, you can either use the success rate we calculate from your request count metric as a baseline indicator, or the success confidence for a more specialized approach.
Success Rate
The success rate is calculated for all your integrations by dividing the number of successful requests to all requests. You can access it from the Fulfillment Success Rate chart in your Google Home Analytics Dashboard.
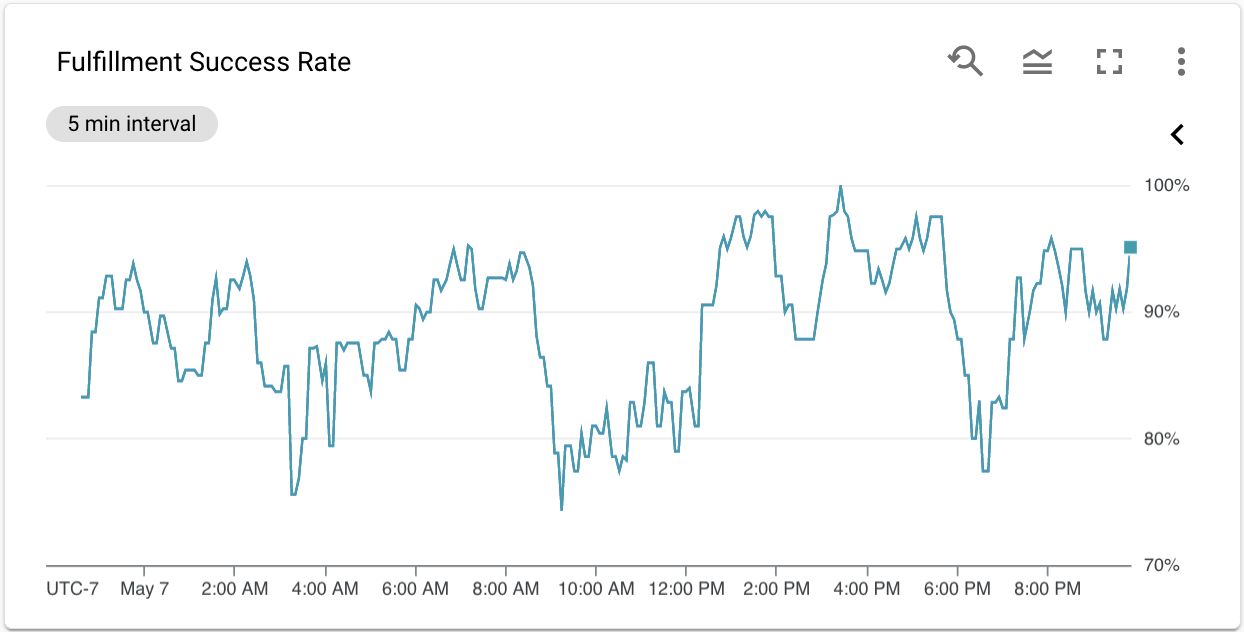
The Fulfillment Success Rate chart is very useful to monitor the performance on your project, but not much so when building your custom dashboards or setting up alerts. Since the success rate is derived from your request count metric, and not a metric by itself, you will have to recreate it using MQL (Monitoring Query Language) in the Metrics Explorer in order to use it with either feature.
Also to track the performance disruptions on your project we think a much more specialized approach is needed. That's why we have created the confidence metric that changes based on how much your current fulfillment success rate deviates from the historic norms.
Confidence Metric
Outages can exist in different shapes and sizes for projects. They can last several hours to only a few minutes, which can make identifying them a challenge. For this we have created a Confidence Metric in your project, which provides a normalized value for predicting reliability based on the past performance. You can access the confidence metric by searching for smarthome in the metrics explorer, then selecting the Execution success confidence.
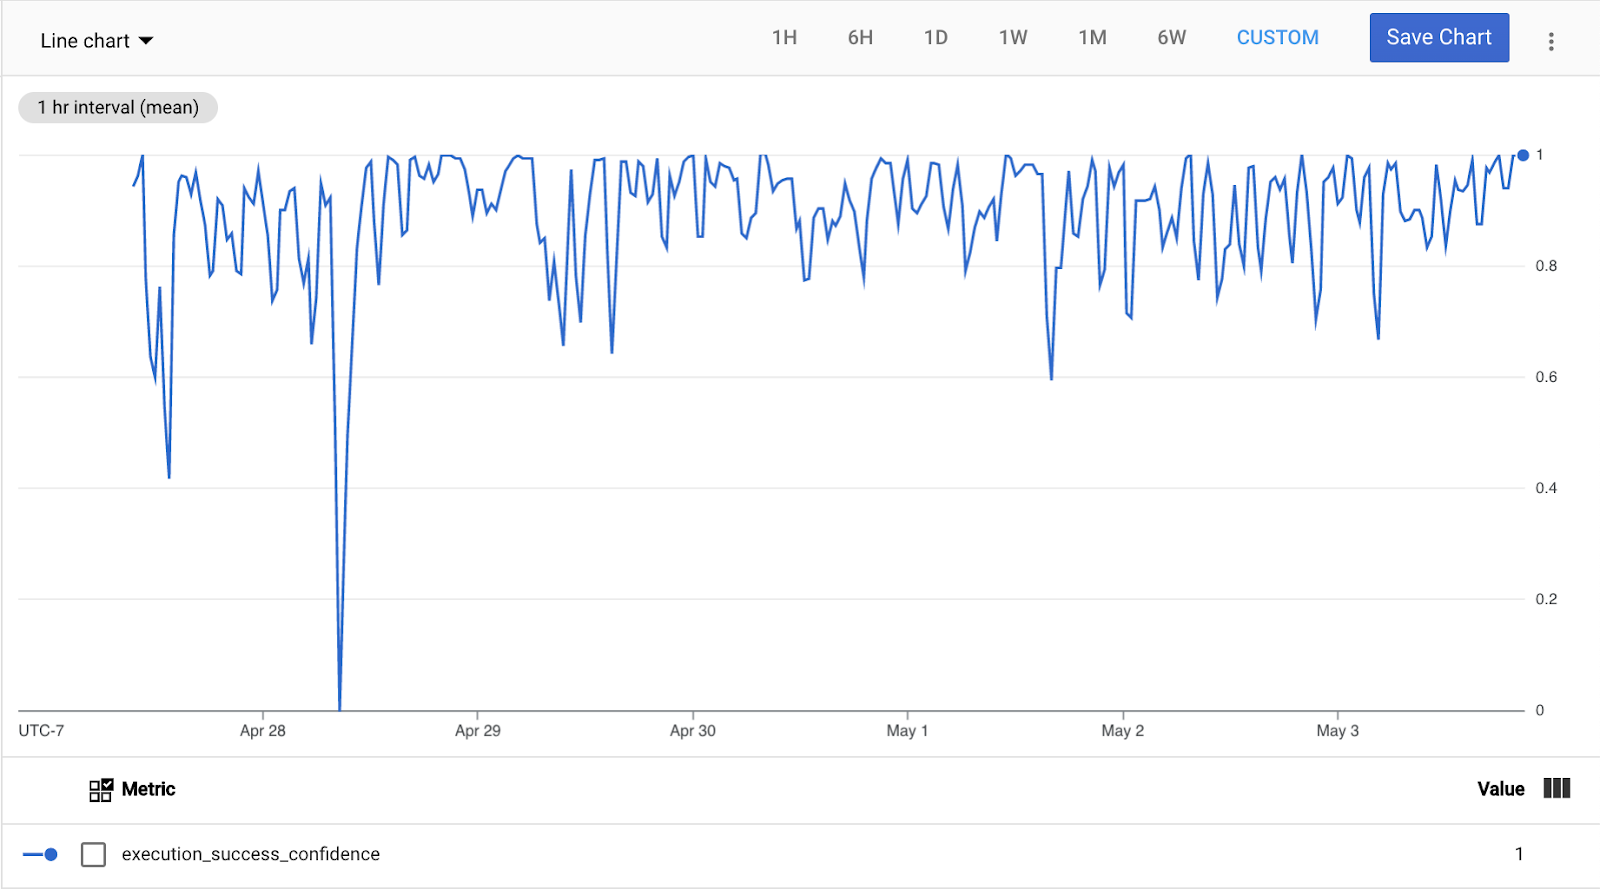
When your smart home integration performs at or above the historic performance (7 day average), this metric will output the maximum value (1.0). When your success percentage deviates by more than a factor of 4 standard deviations (also calculated across 7 days), this metric outputs the minimum value (0.0). For cases where the standard deviations are too small (less than 2.5%), this metric bases the 0.0 value at a 10% drop on success percentage.
For all in-between cases, this metric provides values between 1.0 (perfectly confident that there is no outage) and 0.0 (maximum confidence that there is an outage).
Therefore when setting an alert (coming up in the next section), we recommend basing 0.5 value as a threshold. This will correspond to a 2 standard deviations, or a 5% drop, whichever is higher.
4. Setting Up Alerts
Next step is to use everything you learned in the previous section to set up alerts on your project.
Creating an Alerting Policy
Automated alerting on Google Cloud is set through Alerting Policies. You can access the Alerting Policies through the side menu, Operations > Monitoring > Alerting tab. You can create a new alerting policy by selecting the +CREATE POLICY option, which will bring you to the alerting policy creation screen:
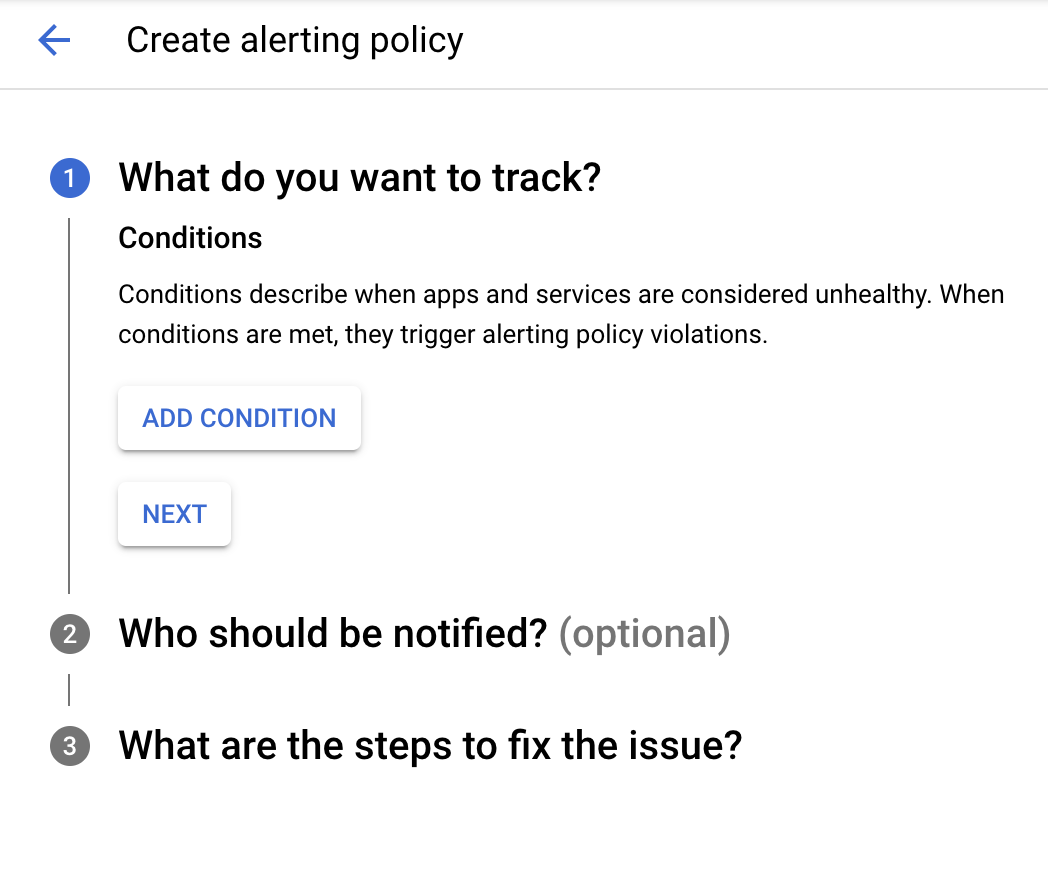
There are three parts to creating an alerting policy. First you need to determine what you want to track by adding a condition. Pressing the ADD CONDITION button will bring up a window similar to Metrics Explorer, with some additional controls for configuring the condition:
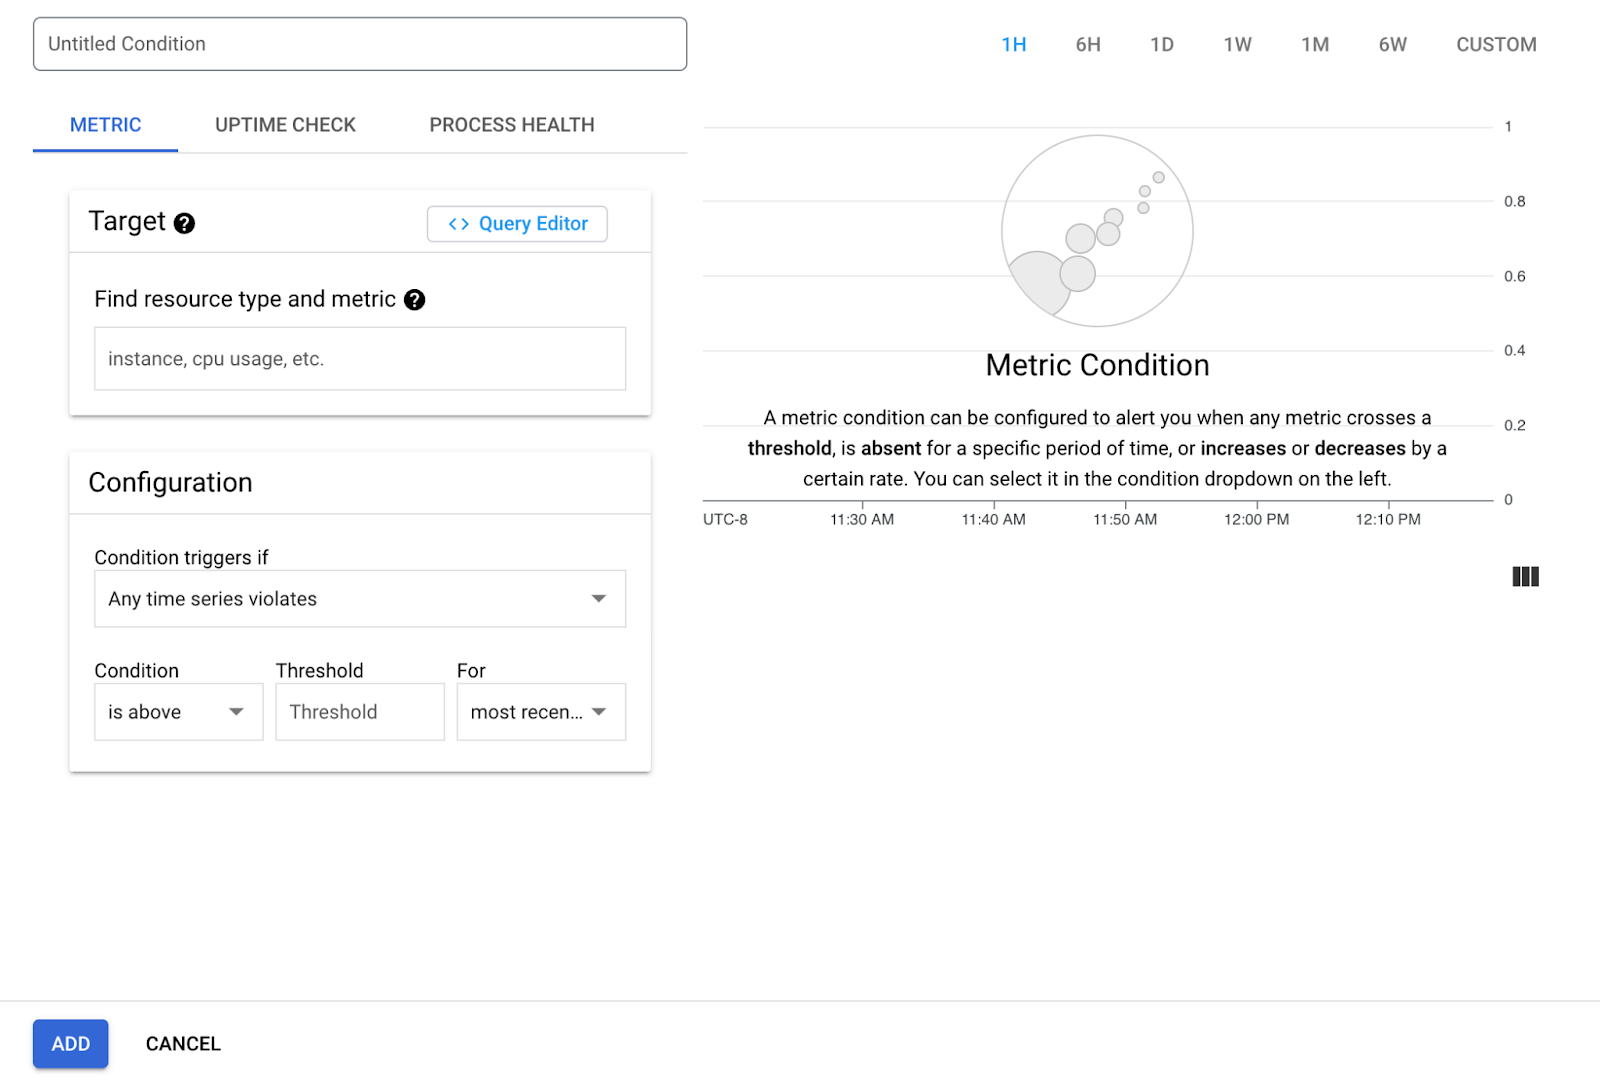
For the target, select the confidence metric we covered in the previous section. Make sure the aligner is set to delta using this metric (Show Advanced Options > Aligner). Next step is to configure the alerting condition and use the following settings:

Condition triggers if - This is the main configuration to determine when to trigger the alerts. Selecting Any time series violates will work as we are going to set a threshold on our metric and monitor if the value is crossed.
Condition - We want the alert to be triggered when the value drops below the threshold so we'll set this to is below. With our metric, 1.0 means the integration is working fine and 0.0 indicates a definite outage.
Threshold - We have created the confidence metric to provide best results when this value is set to 0.5. If you want to have more frequent alerts and get notified for lesser incidents, you can try increasing this value (max 1.0). Subsequently if you want to get alerted less, only for more severe issues, you can try decreasing this value (min 0.0).
For - This is the setting to identify how long the outage should last before you get alerted. We recommend keeping this setting at the most recent value to get alerted for any point crossing the threshold. Our confidence metric is published every 15 minutes, looking at the average success in that period.
Once you complete adding a condition, the next step is to select the notification channel. The simplest method of notification is the email alerts. You can pick an email listed under Notification Channels dropdown:
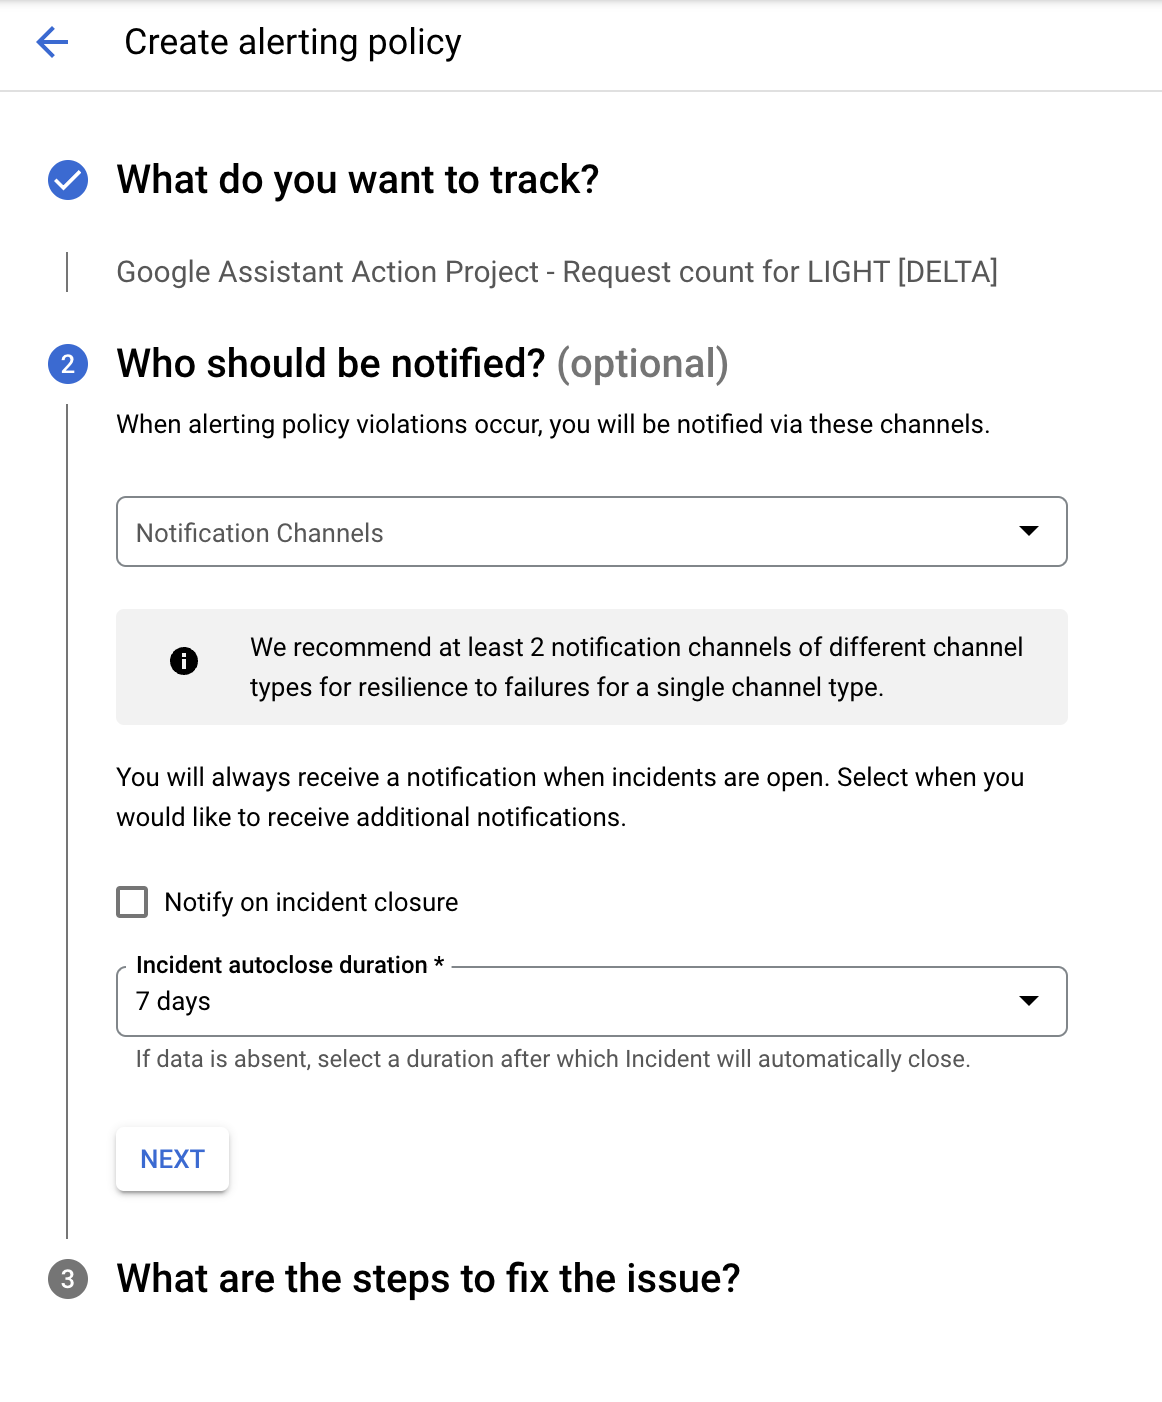
If you check the Notify on incident closure option there will be another notification sent once the incident is marked closed. In that case, you should also select an Incident autoclose duration, which is specified as 7 days by default.
The final step is to give your alert a name, and add any documentation you want included in the notifications.
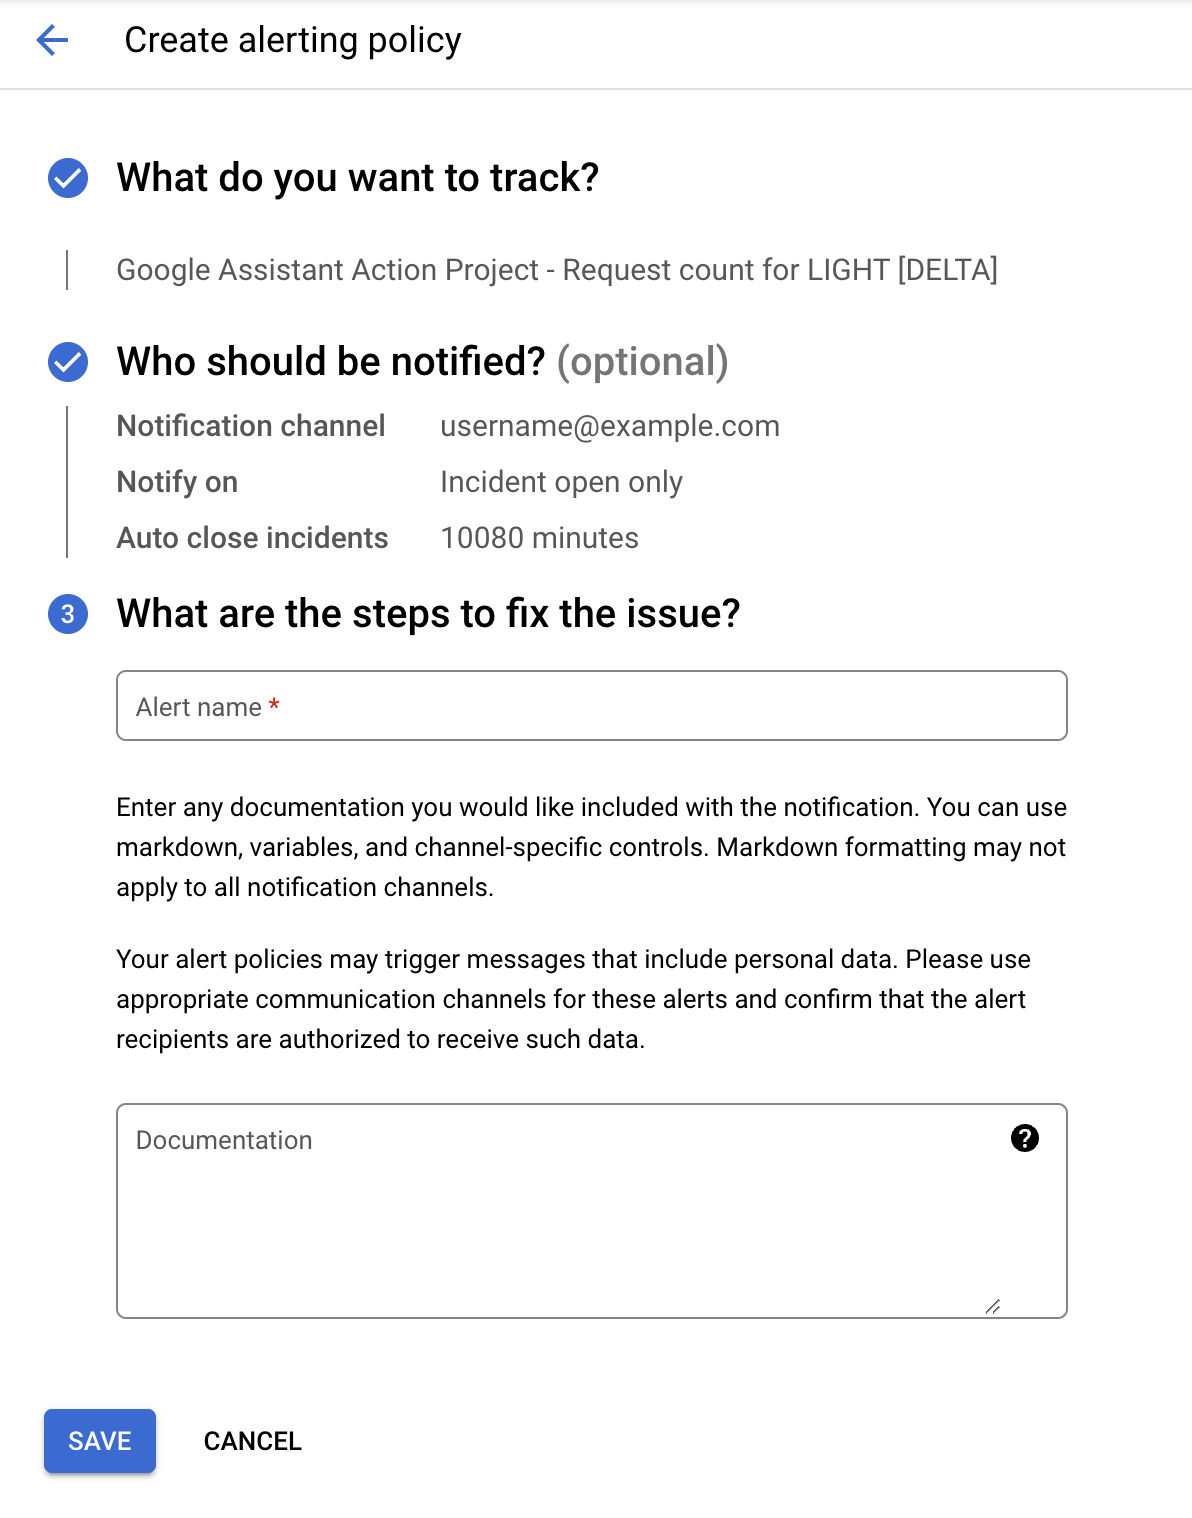
Providing documentation is recommended, especially if you are not the one that will be receiving the alert. Adding steps like where to check during an incident and how to triage and debug can help during an outage. You can refer to our Troubleshooting Guide as needed.
Once saved, your alerting policy will be listed under the Policies section on the Alerting page.

5. Mitigating Outages
Once you set up alerts, you will be notified during outages from the notification channels you provided, as well as an incident entry will be created in the Alerting page.
Receiving Alerts
The alerting channel we provided in this codelab was an email. Once you set, hopefully you don't receive any alerts (not have any outages), but if you do the notification will look like the following:
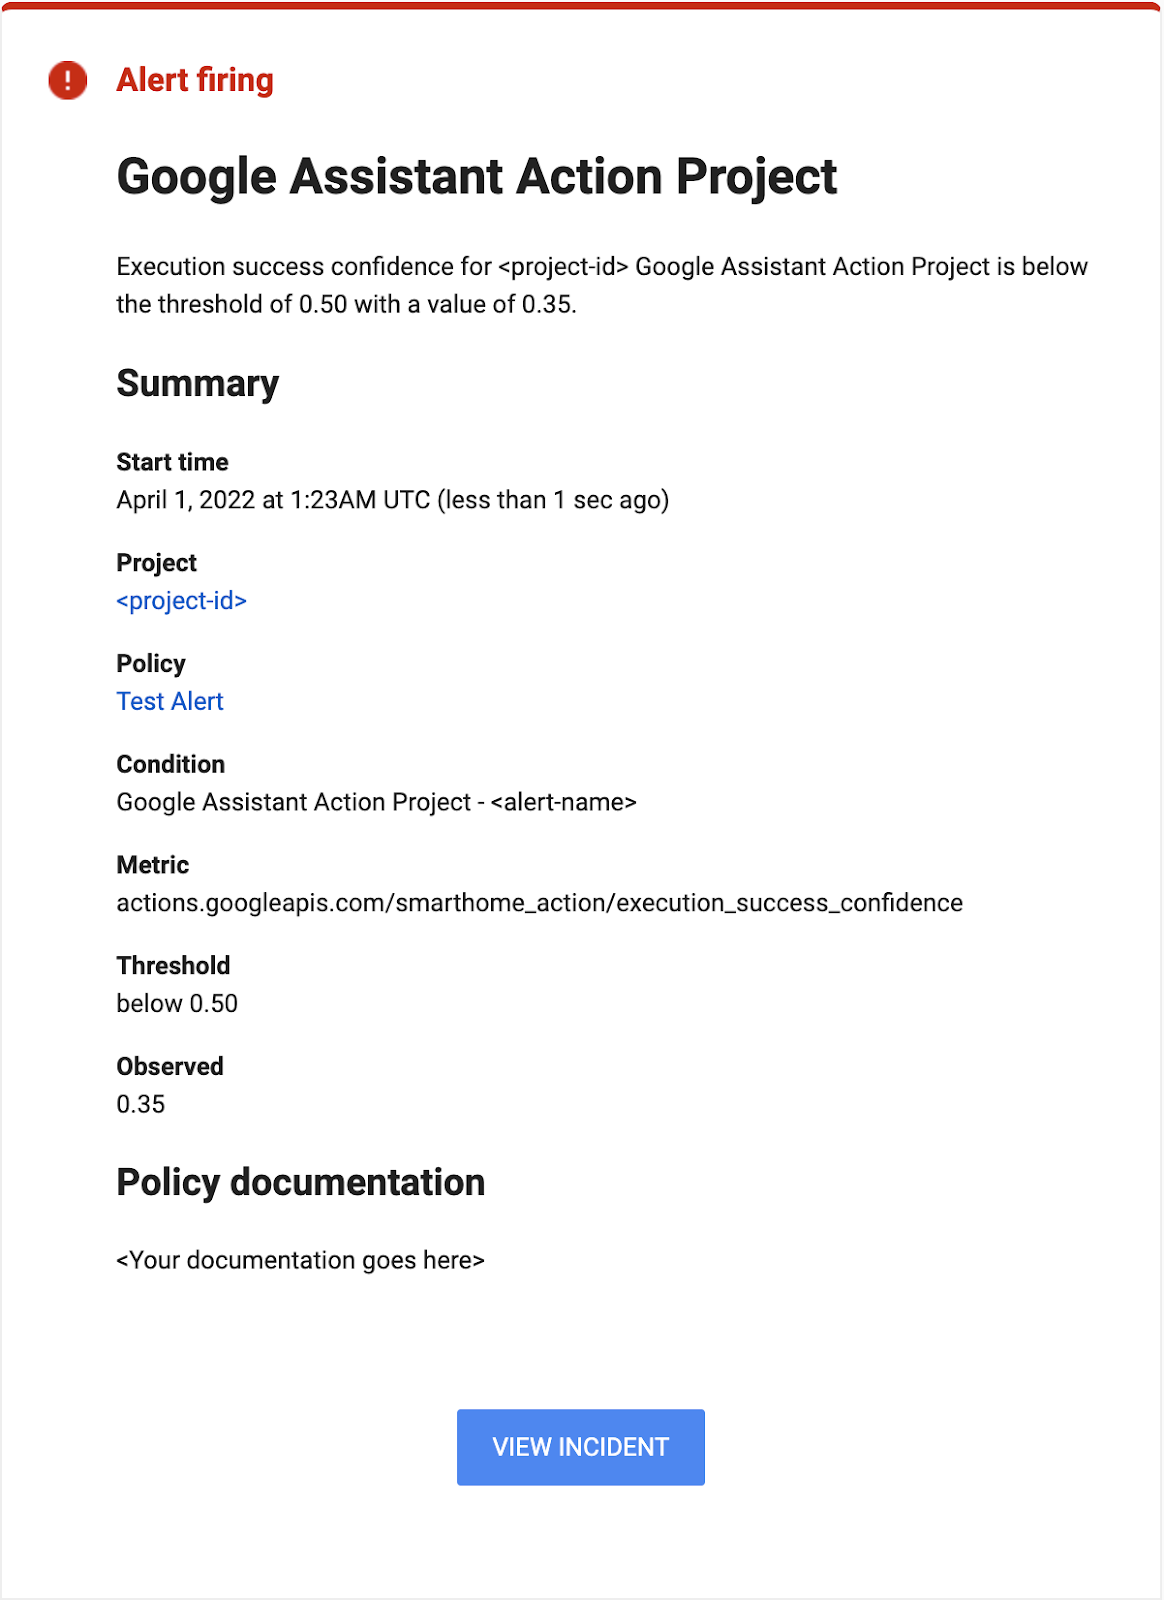
Notice the alerting notification does provide the observed value crossing the threshold you specified, as well as a timestamp outlining when the incident has first started.
Monitoring Incidents
As incidents happen, they will also be counted in the incidents section on the Alerting page.
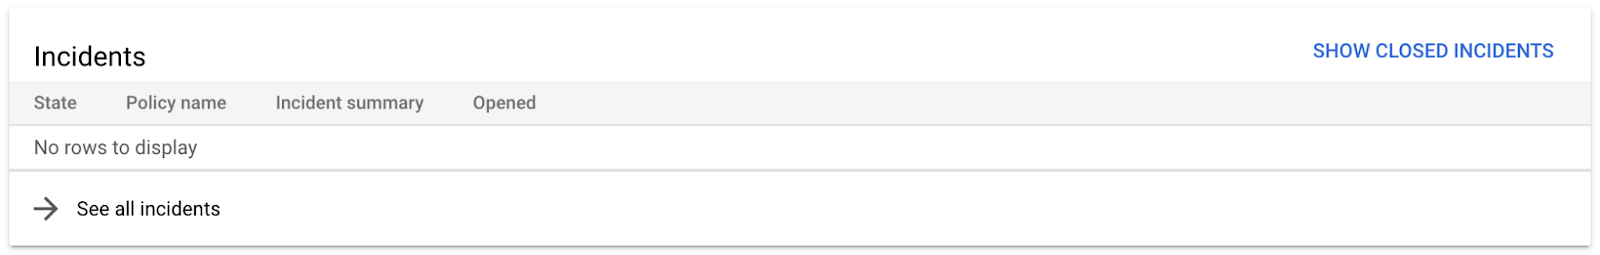
You can click on the specific incident to see the details regarding the outage, such as how long it lasted or how severe it was.
Remember, as you receive alerts the best first step is to take a look at your metrics, then search the errors contributing to your outage in your logs. You can have a refresher on how to do these in our Debugging the Smart Home codelab.
6. Congratulations
Congratulations! You successfully learned how to set up alerts using the metrics provided to your project to monitor outages in an automated fashion and get notifications during service disruptions.
Next steps
Building off this Codelab, try the following exercises and explore additional resources:
- You can combine what you learned in this codelab with other metrics provided to your project. You can see the full list of available metrics in the Supported Metrics section of the Monitoring page.
- Explore other types of notification channels for alerts that are explained in the Notification Options page of the Google Cloud documentation.