
1. Before you begin
As we have covered in Debugging the Smart Home codelab, we are publishing metrics and logs to your Smart Home projects. Metrics help you to determine where your Smart Home Action is having trouble, and logs are useful when making a deep dive to solve these problems.

Besides the metrics we make available to your project, you can also generate your own metrics using the Log-based Metrics from Google Cloud. This allows you to monitor certain patterns within your logs and effectively debug quality issues.
Prerequisites
- Have a Works with Smart Home Integration
- Complete Debugging the Smart Home codelab
What you'll learn
- How to write effective queries to filter Smart Home error logs
- How to create log-based metrics to generate metrics from your queries
- How to create charts and dashboards from log-based metrics for monitoring
2. Working with Logs
As we briefly covered in Debugging the Smart Home Codelab, working with logs is key for your project's success. There are great tools available on Google Cloud to monitor and analyze your logs. To access all logs available to your project, you can use Logs Explorer.
Accessing Logs
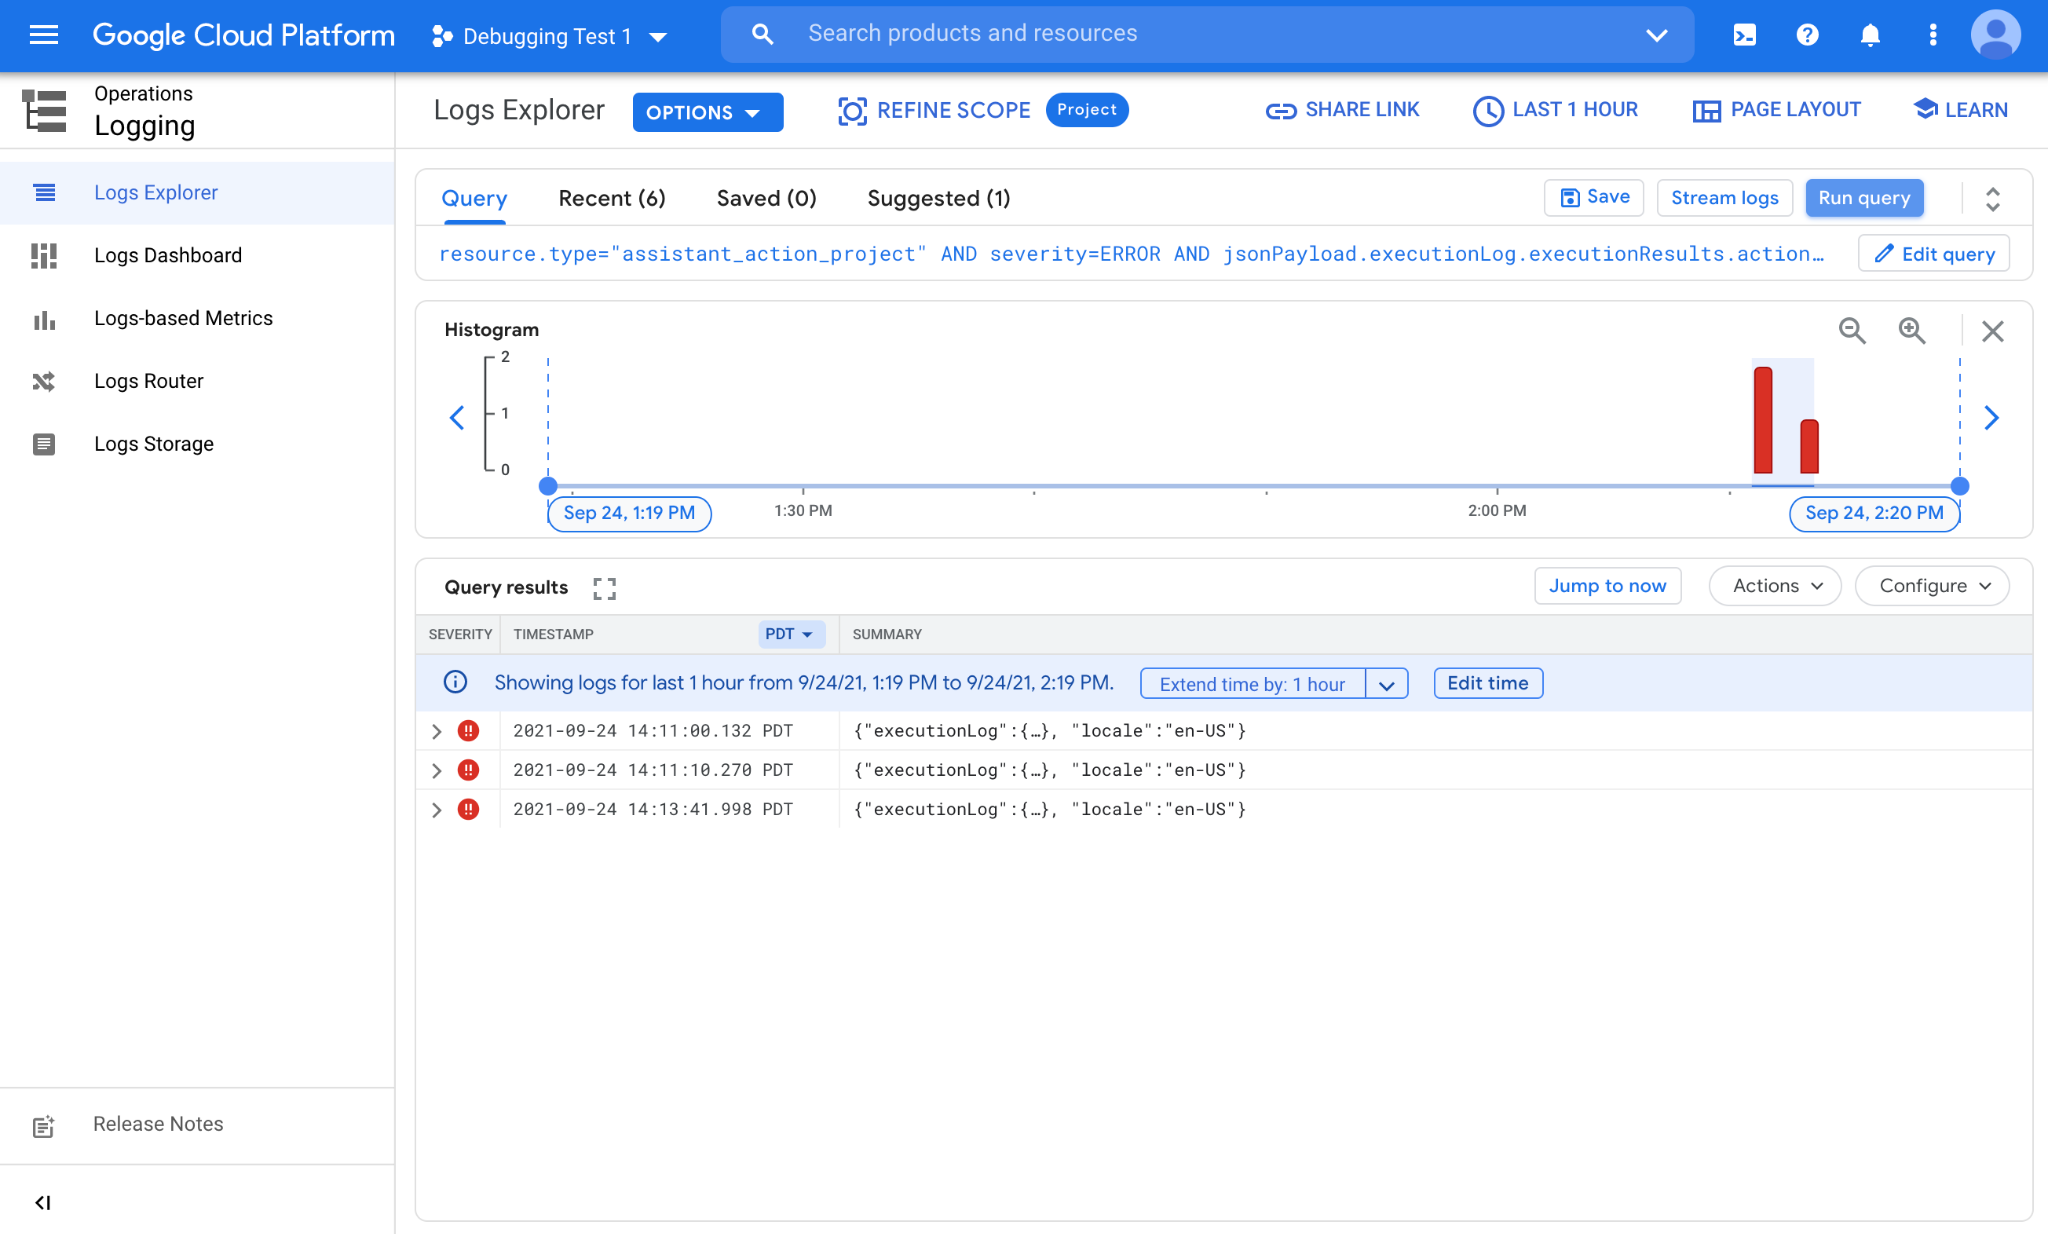
First step to access your logs is to sign in to Google Cloud and choose your project. Navigate to Logs Explorer using the side menu, by going through Operations > Logging > Logs Explorer. Once you open up the tool, you should see this view:

Logs Explorer consists of two main sections: A section to write your queries on top (Query builder), and an area to show the matching results (Query results).
Many different components across Google write logs to your project by default. In order to find and work with the logs coming from your Smart Home integration, you must write custom queries.
Writing Queries
Logs are published to projects under a resource type. Each resource type represents a different platform within Google. Logs coming from the Smart Home platform are available to your project under the assistant_action_project resource type.
Also, all logs are assigned a severity level at creation. With Smart Home logs we use the ERROR level for logs representing errors and exceptions, and DEBUG level for everything else.
In the following example we will write a query to filter logs coming only from our platform that represent errors, as follows:
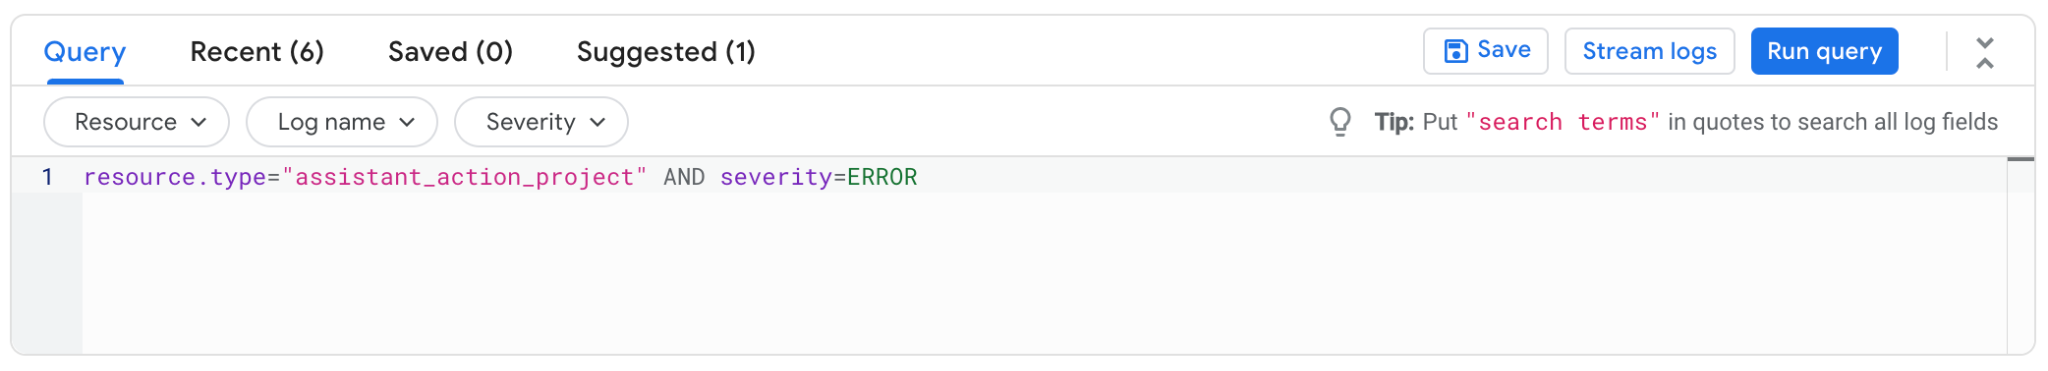
Once you are done writing the query, click the Run query button to initiate the query. This should bring up errors coming from your Smart Home integration:
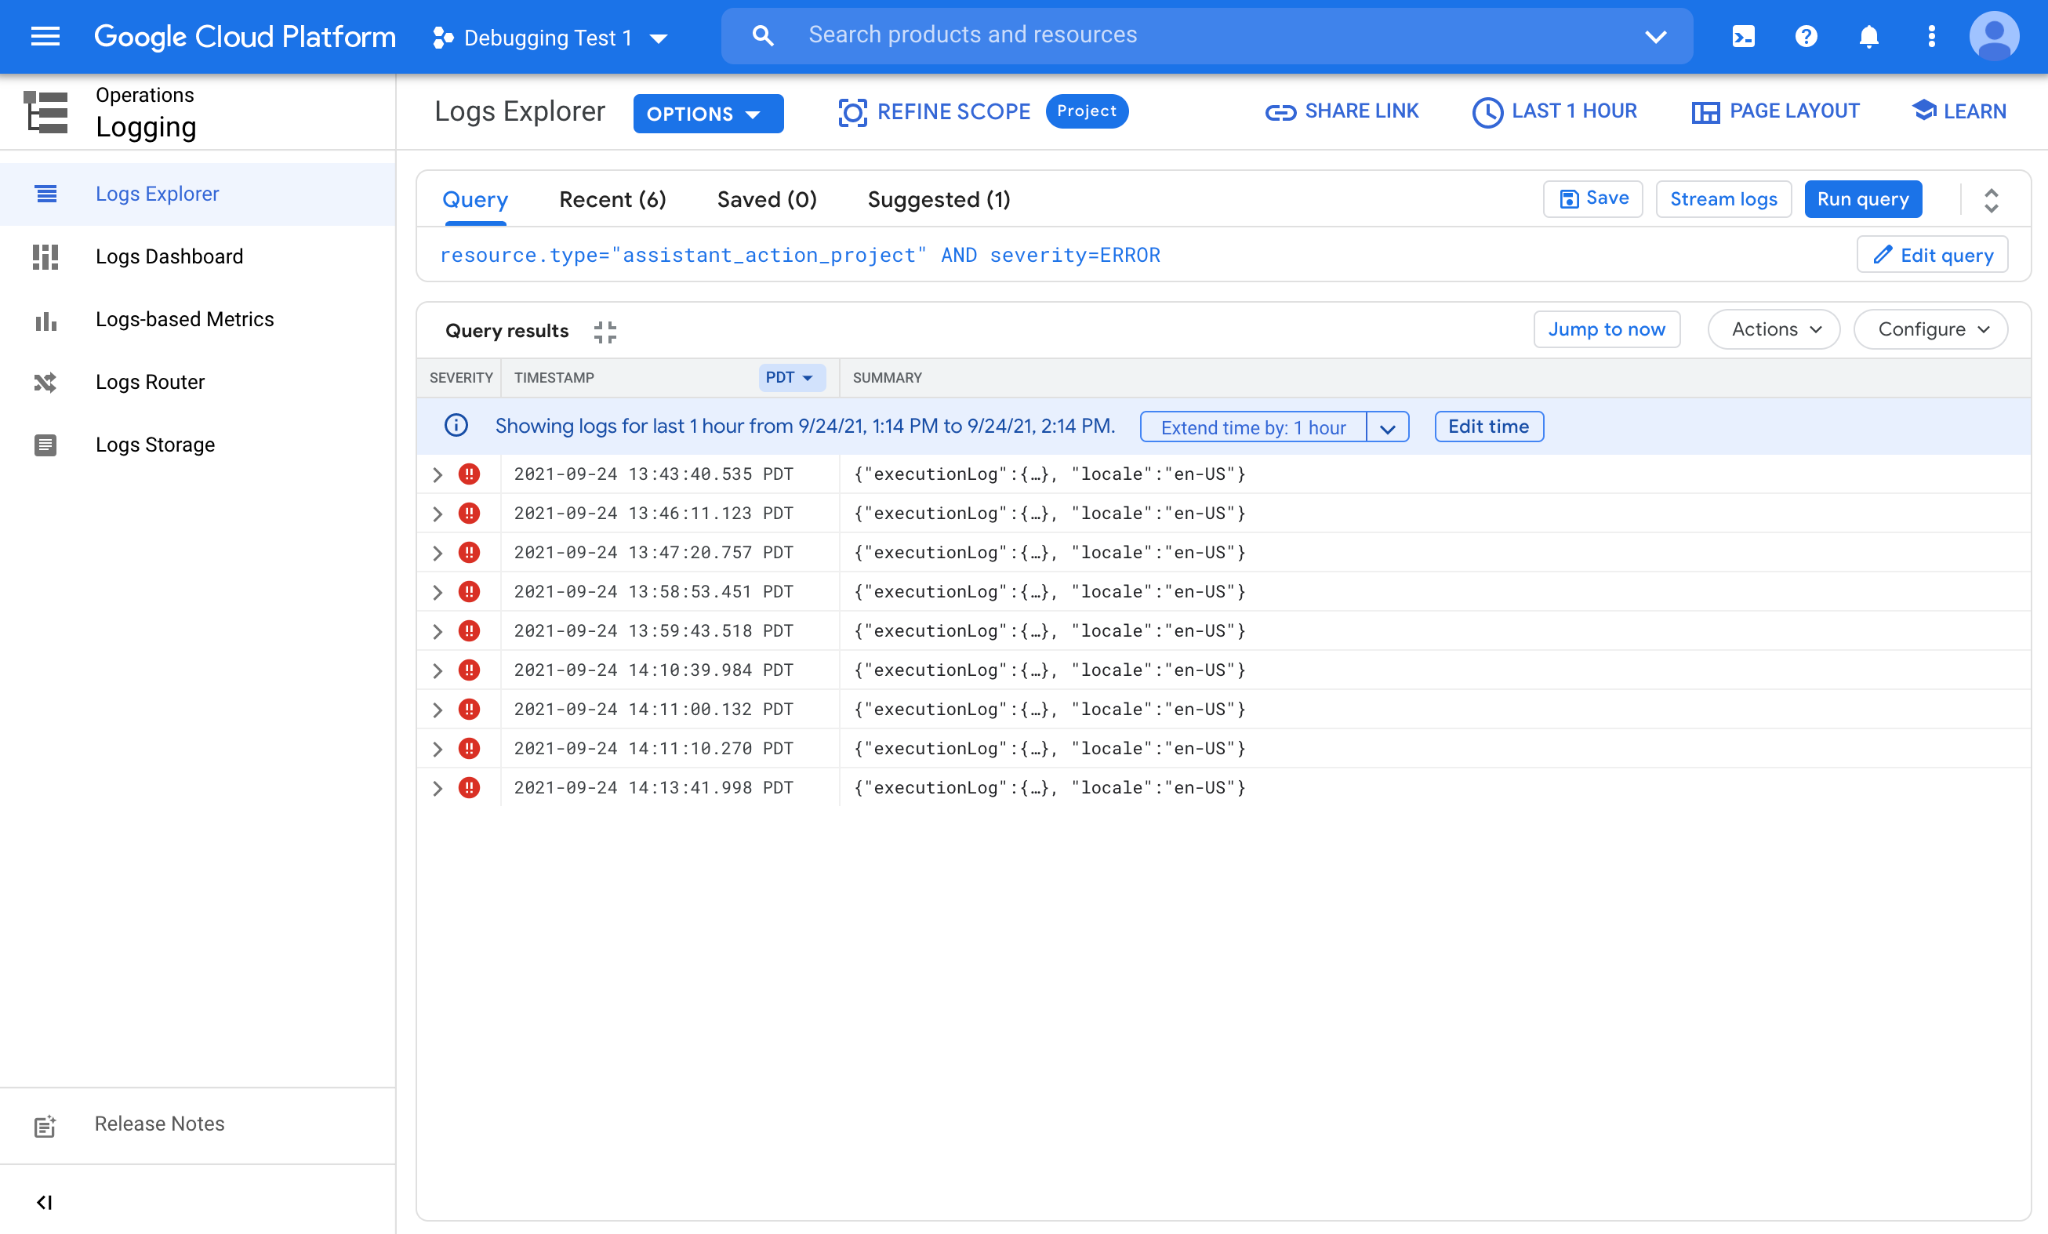
As you see we have a number of errors that came at various times over the last hour. Each line represents a single error log. You can further click on the individual logs and expand nested fields to see the information contained within.
Using Histogram
Logs Explorer provides a useful Histogram feature to see the time distribution of logs that match your query. To activate the Histogram, click on PAGE LAYOUT from the upper-right corner buttons and check Histogram to enable the feature.

Once enabled, you will see a distribution of the logs matching your query:
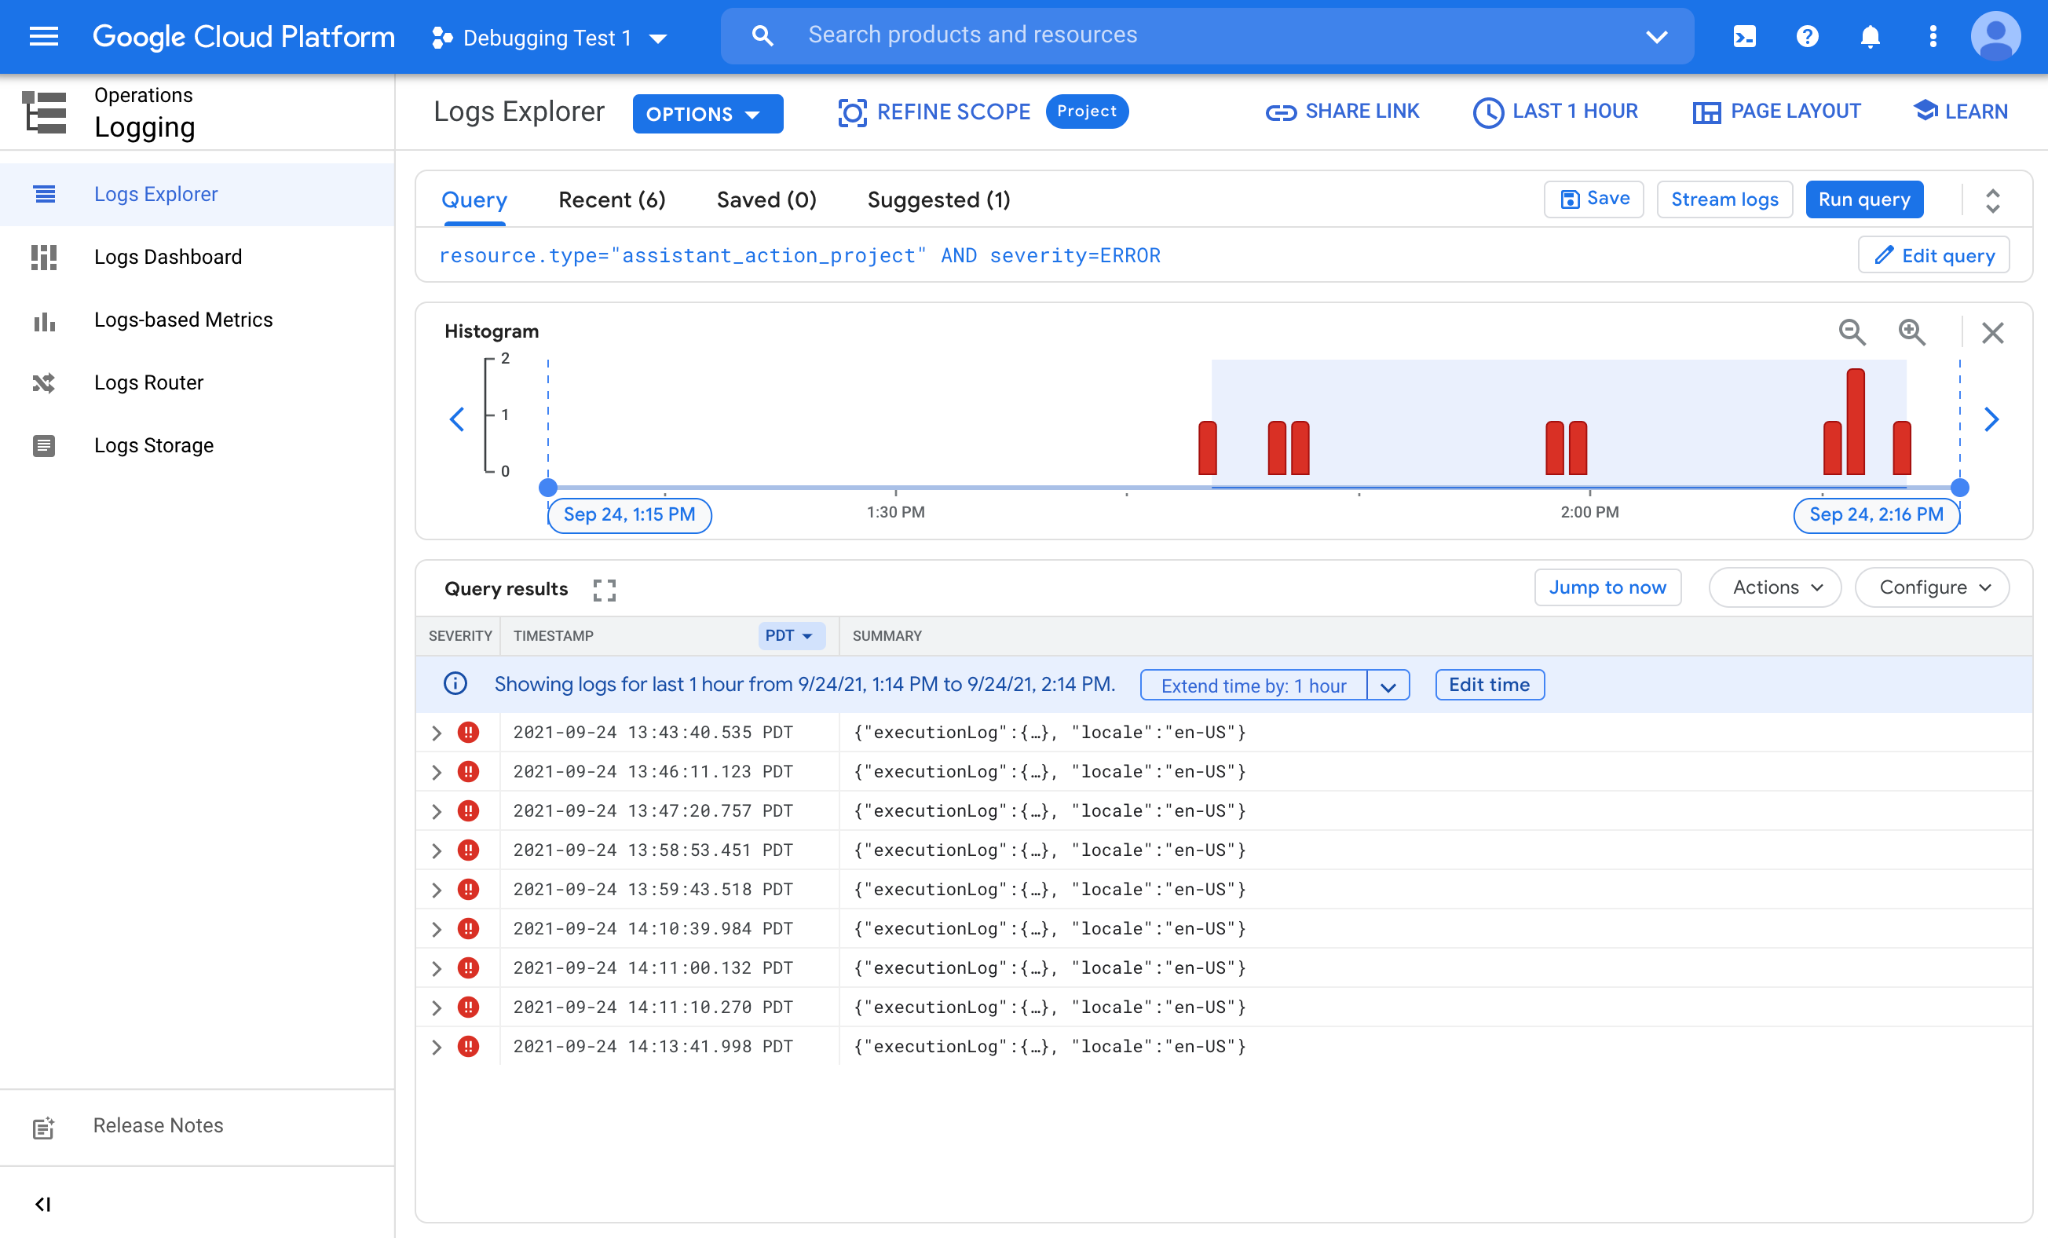
As you can see in the above image, we have several errors that are sparsely clustered across the past hour. They seem to form three clusters around 1:45, 2:00, and 2:15 PM. Histogram can help you to detect patterns that would be hard to see by checking the timestamp values only.
Right now the query we use does not differentiate between logs and shows us all errors coming from our Smart Home Integration. There are many times where you might want to differentiate between errors, for example to track error patterns originating from certain device types or traits. To do this, we'll take a look at writing advanced queries.
Advanced Queries
When you inspect a Smart Home event log, you'll see there are various fields that you can gather information from:
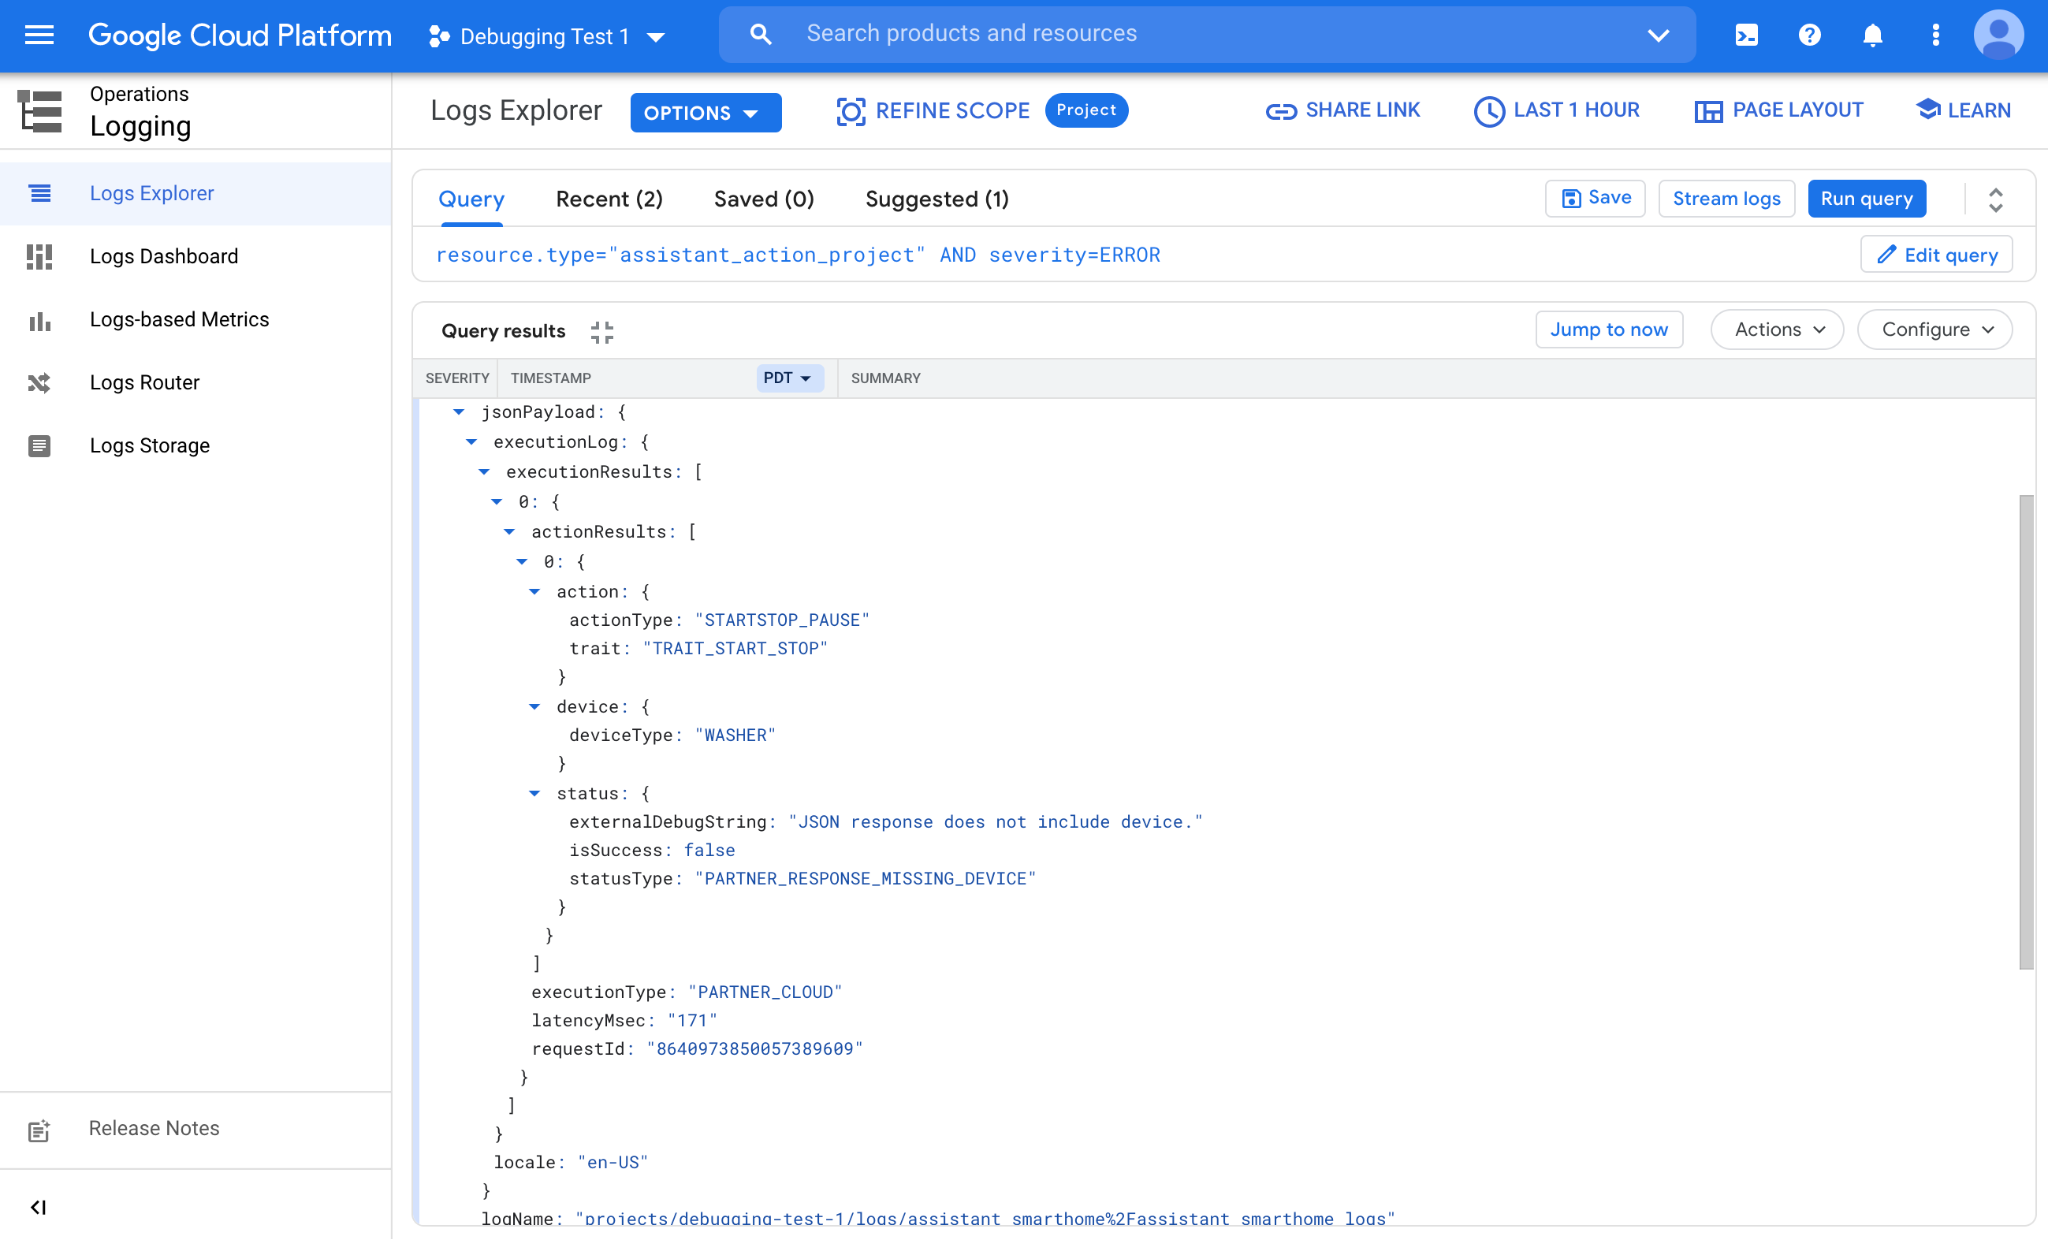
action
trait: Target device trait by the user (for example, OnOff, StartStop, Brightness)actionType: Fine grain state of the trait (for example, On, Off, Pause, Stop, Resume)
device
deviceType: Target device type by the user (for example, Light, Switch, Washer)
status
isSuccess: Whether the result of the action is considered successful (true / false)statusType: Status code for the action result (indicates an error code if unsuccessful)externalDebugString: Debug string for the action (describes the error in detail)
Other fields
There are also additional fields that you can derive information from:
requestId: A unique id associated with the request (generated by Google)executionType: Path used by the request (indicates whether Cloud or Local)latencyMsec: Perceived latency for the request on Google Servers (in msec)locale: Which language/region pair the request is sent from (for example, en-US, fr-FR)
By using the trait field from the above list, we will modify our query to only include errors that come from OnOff trait as follows:
resource.type="assistant_action_project" AND severity=ERROR AND
jsonPayload.executionLog.executionResults.actionResults.action.trait="TRAIT_ON_OFF"
After running our updated query, the system identifies the logs and shows us the corresponding result:
So far we have done all our queries manually. That's a great way to quickly check the state of errors, but not so much to monitor the shifts in error patterns over time. To automate this flow and capture data from longer periods of time we will create log-based metrics.
3. Log-based Metrics
To count the number of logs that match your queries over time you can use log-based metrics. This will allow you to see patterns and across your logs and give good insights on the underlying issues.
Creating a Log-based Metric
To create a log-based metric, navigate to Operations > Logging > Log-based Metrics. This will show you the list of log-based metrics already available on your project. Once you click on the CREATE METRIC button, you'll be presented with the log-based metric creation screen:
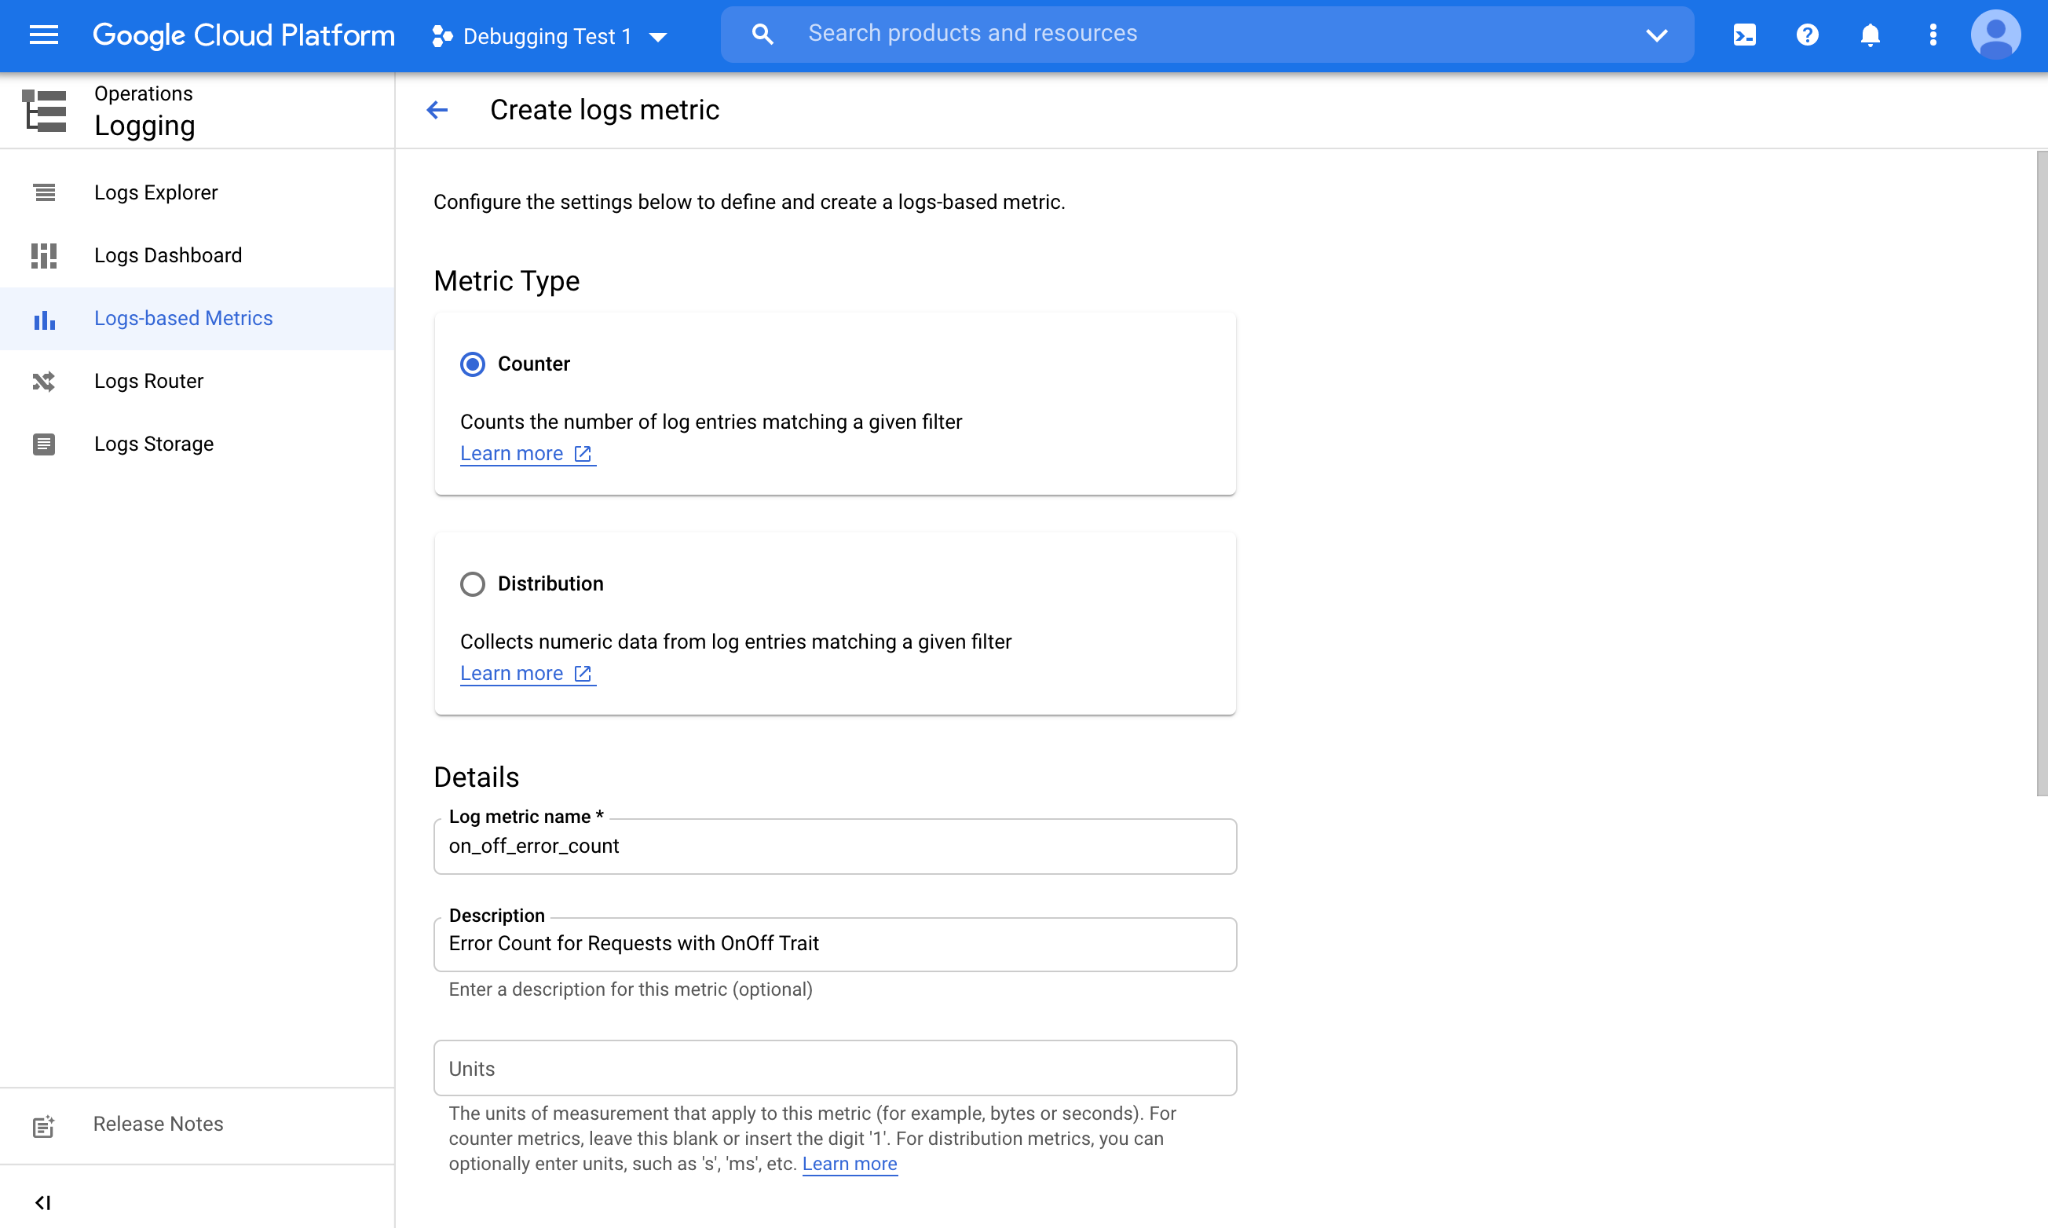
There are two primary metric types: A counter metric counts the number of logs that match your query. A distribution metric keeps track of the underlying distribution and allows statistical operations such as mean, median and 95th percentile.
Scrolling down you'll see a filter section where you can type your query.
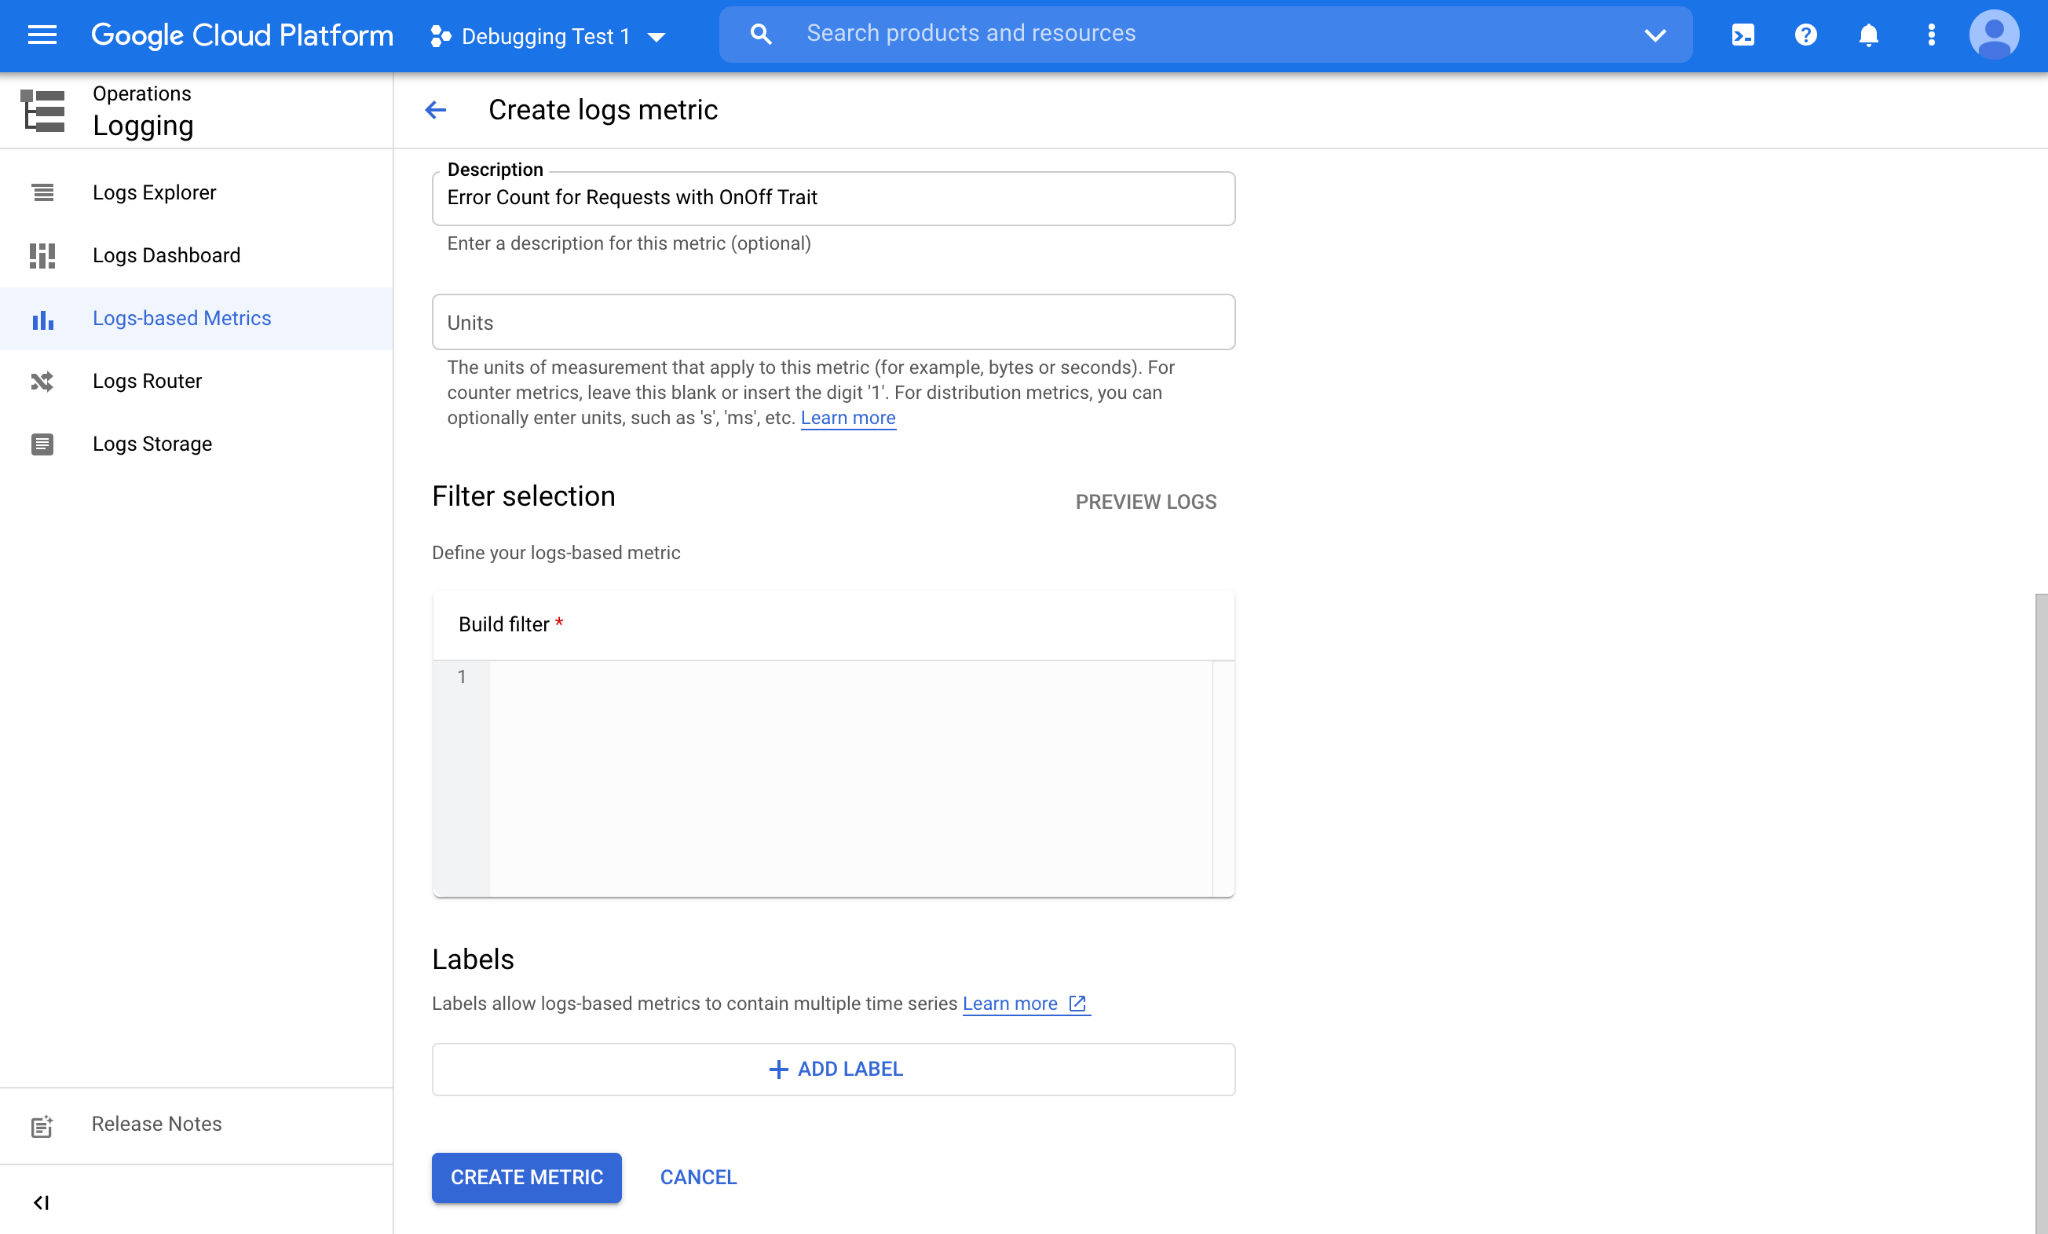
We will paste our query from the previous section in the Build filter text area.
resource.type="assistant_action_project" AND severity=ERROR AND jsonPayload.executionLog.executionResults.actionResults.action.trait="TRAIT_ON_OFF"
You can also click the PREVIEW LOGS button to see a quick view of the past logs matching your filter. Once you are done, you can click on the CREATE METRIC button and advance to the next section.
Viewing Log-based Metric Data
Now that our log-based metric is created, it will be available in the User-defined metrics section of the Log-based metrics page.
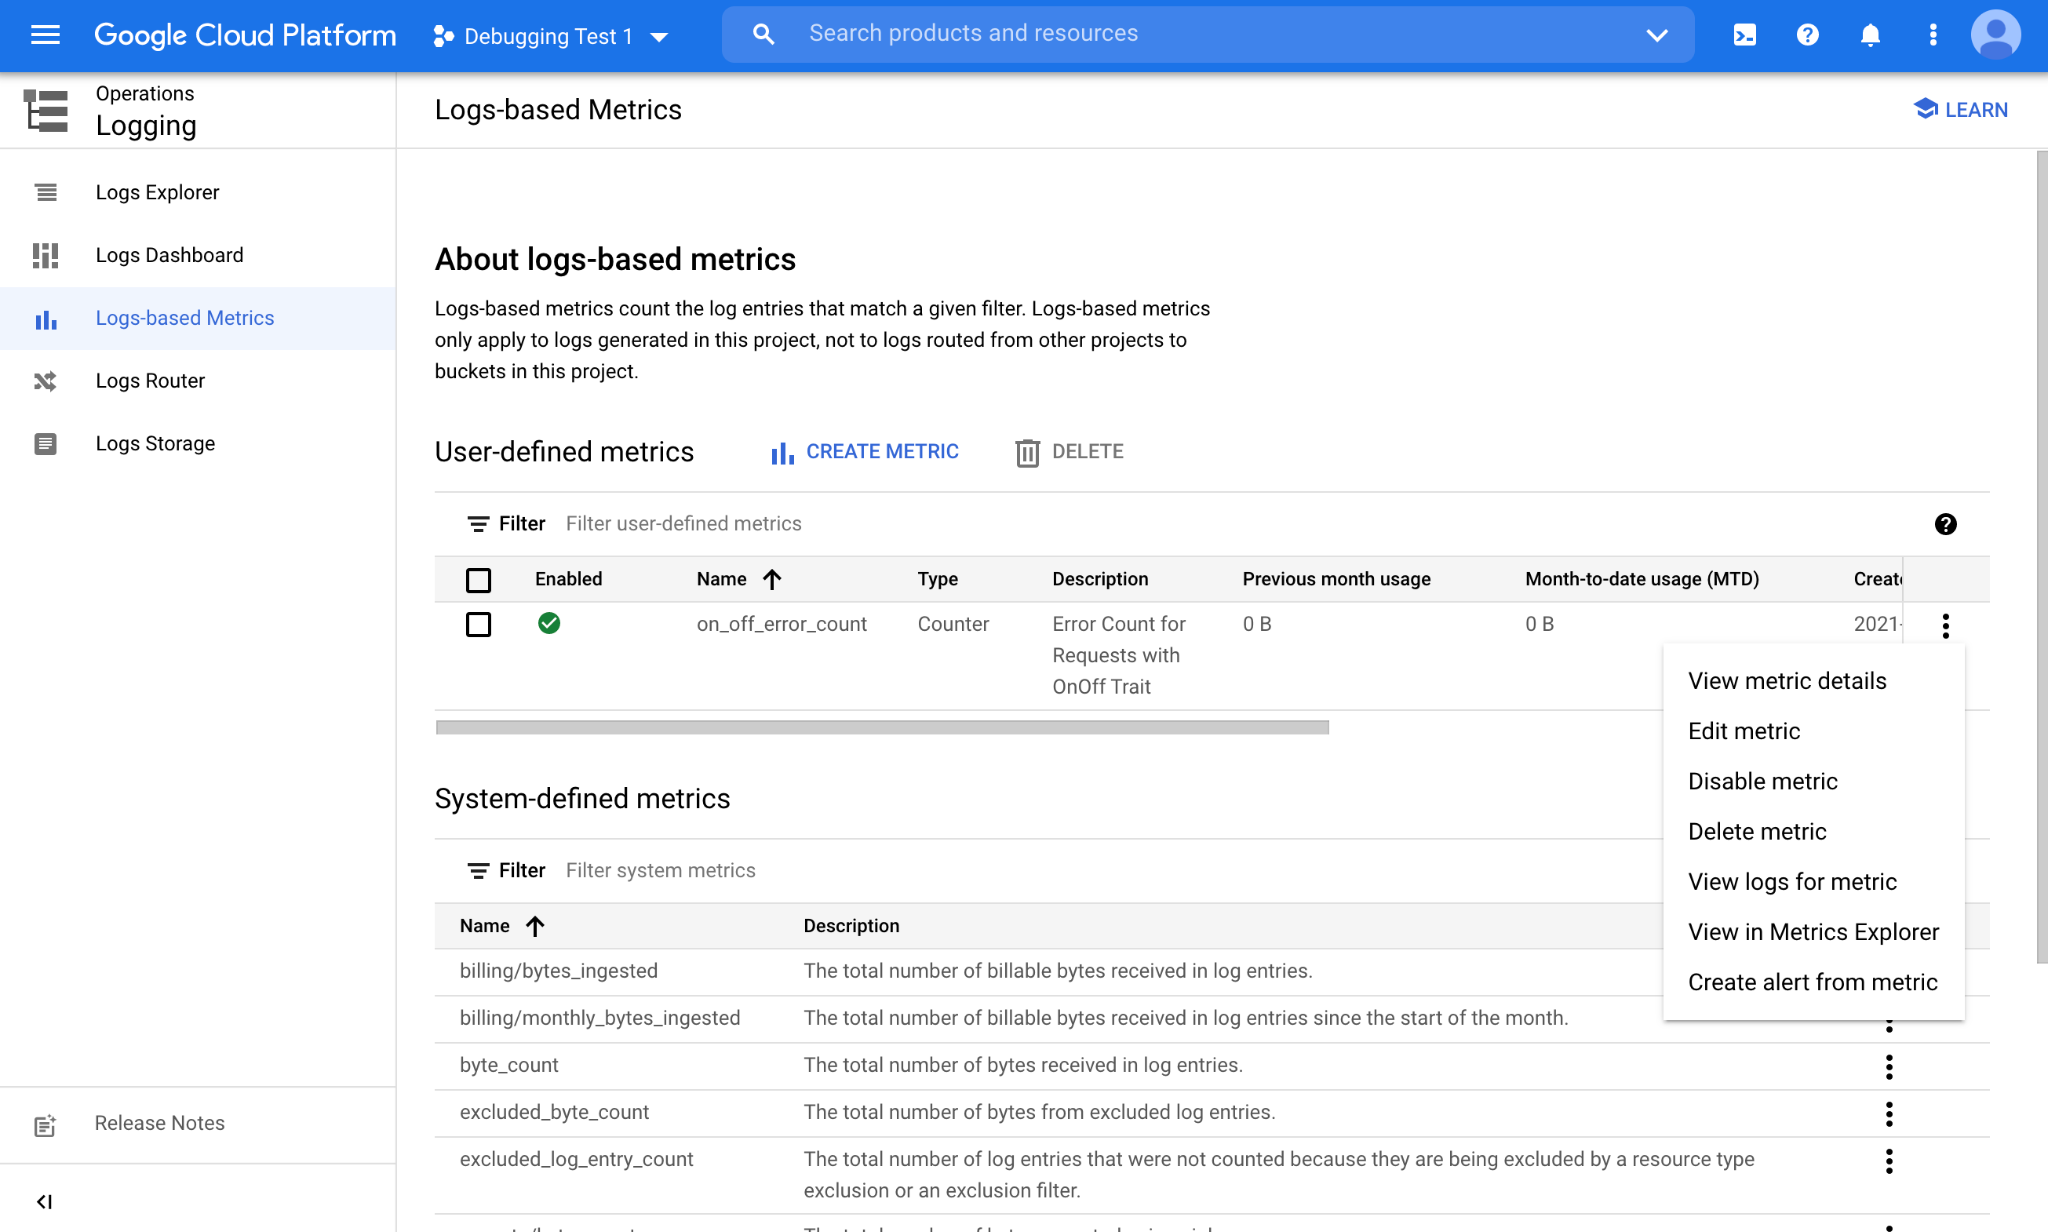
From the menu corresponding to the log-based metric (3 dots), select View in Metrics Explorer to see the data collected in the log-based metric:
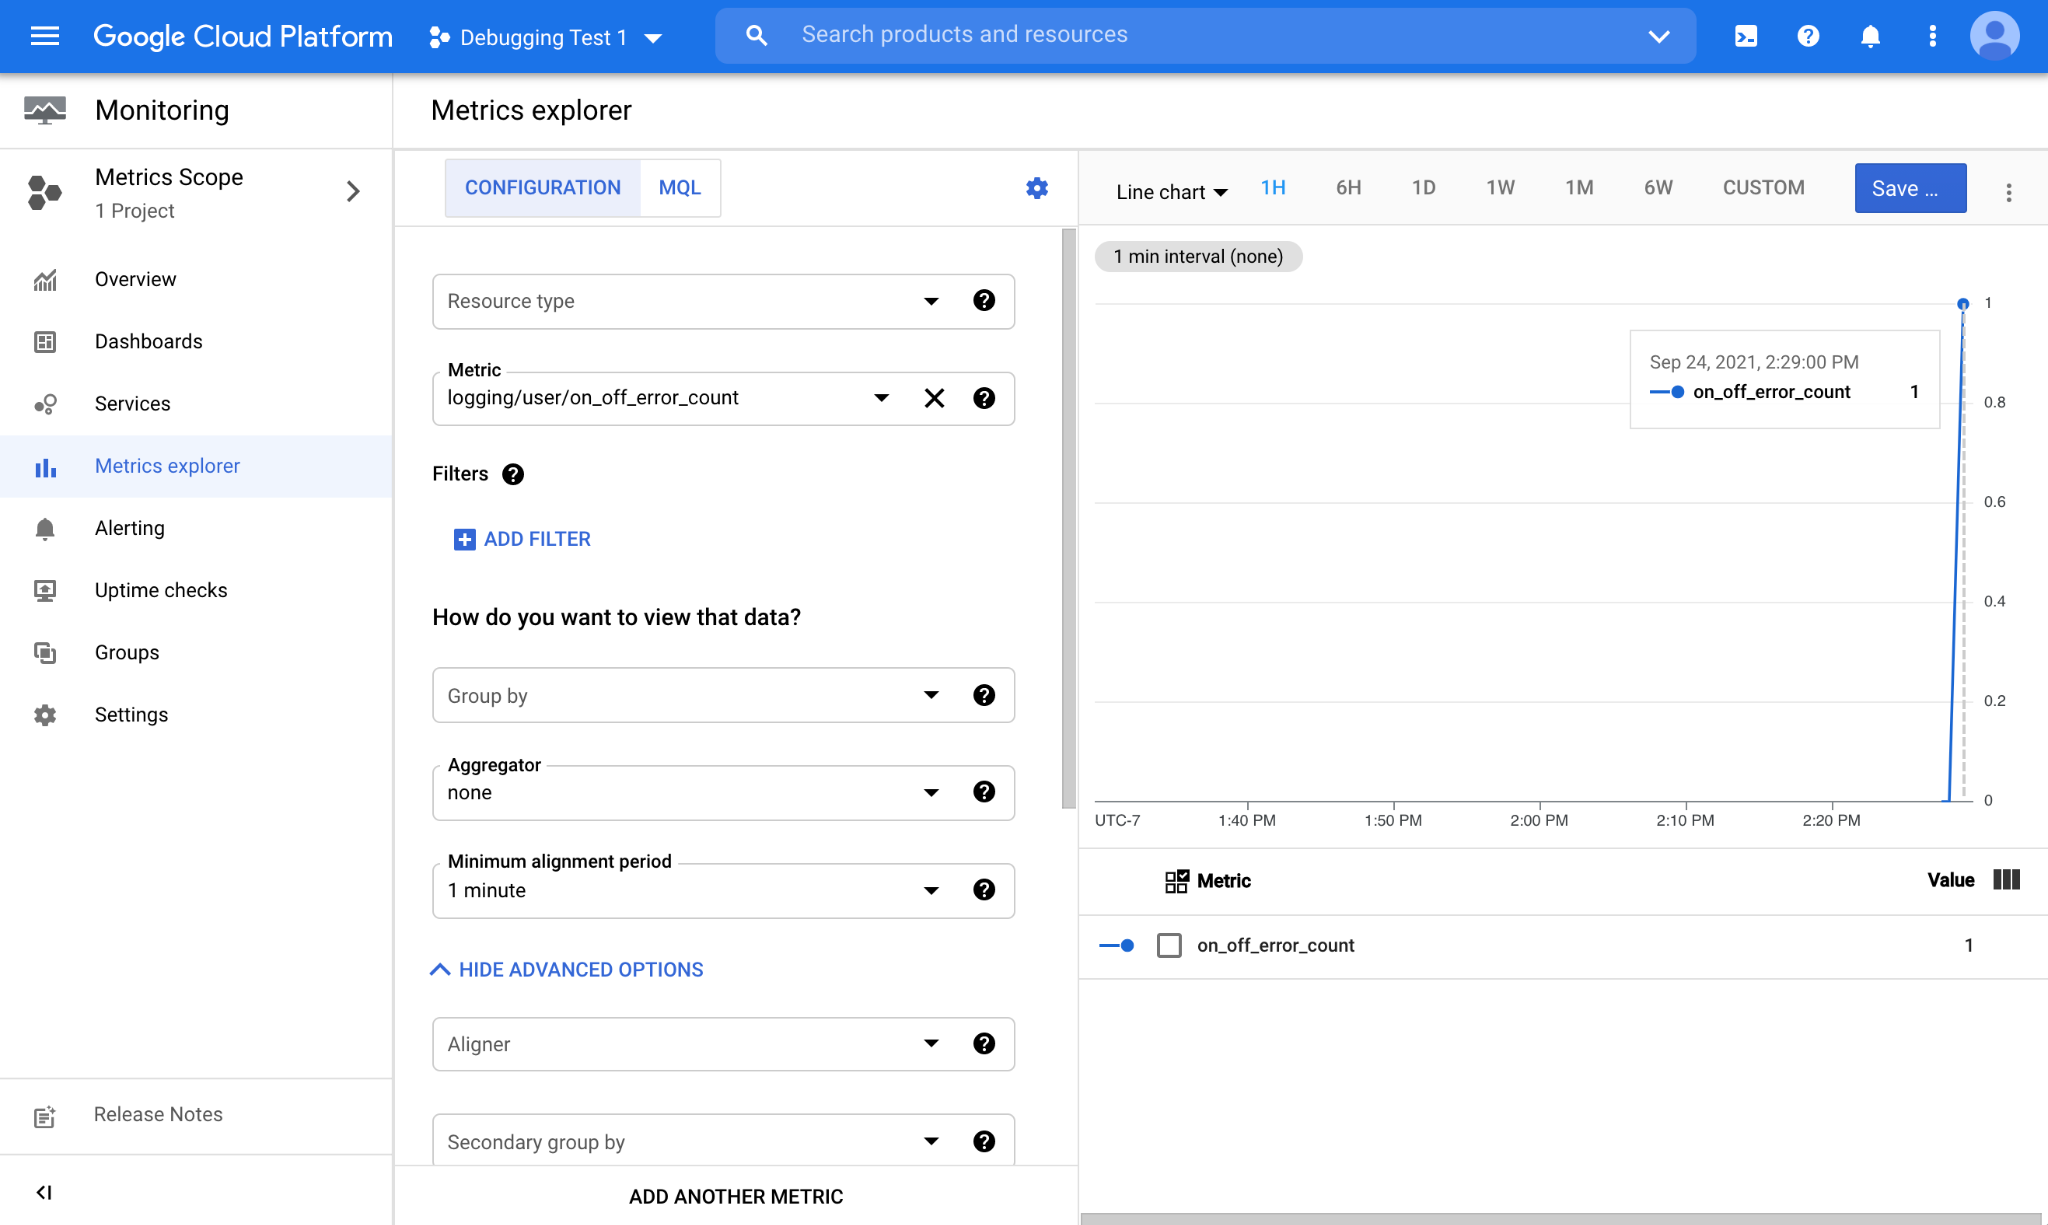
Once we have a new error, it will be captured by our log-based metric and displayed in the chart window in the Metrics Explorer.
Monitoring via Custom Dashboards
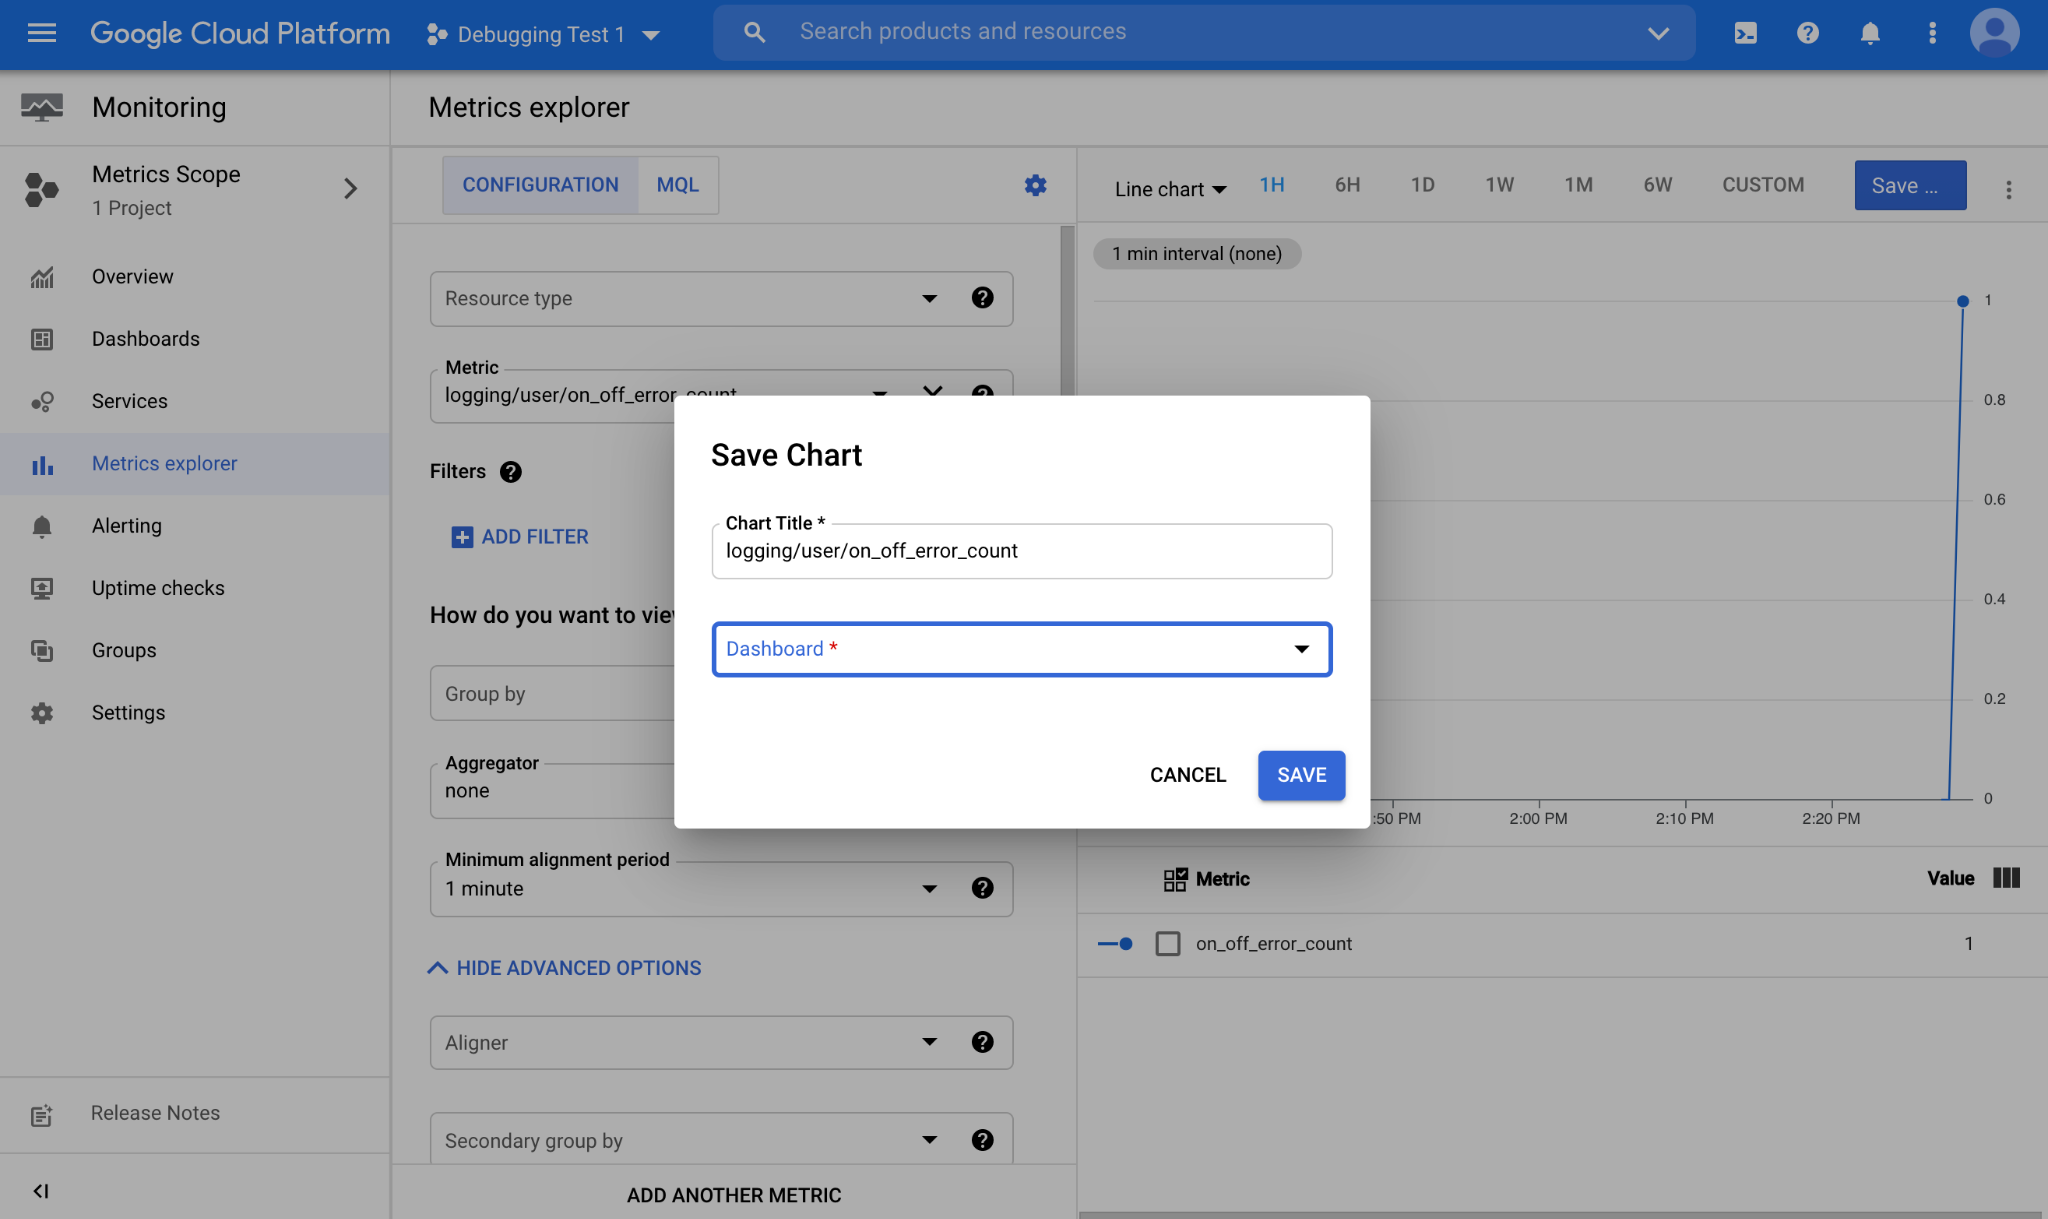
Once we see our new log-based metric is functioning as intended, it is time to save this chart view into a custom dashboard. For this, click on the Save Chart button on the upper-right corner of the Metrics Explorer. This will bring up a prompt to name the chart and select the Dashboard you want to save into:
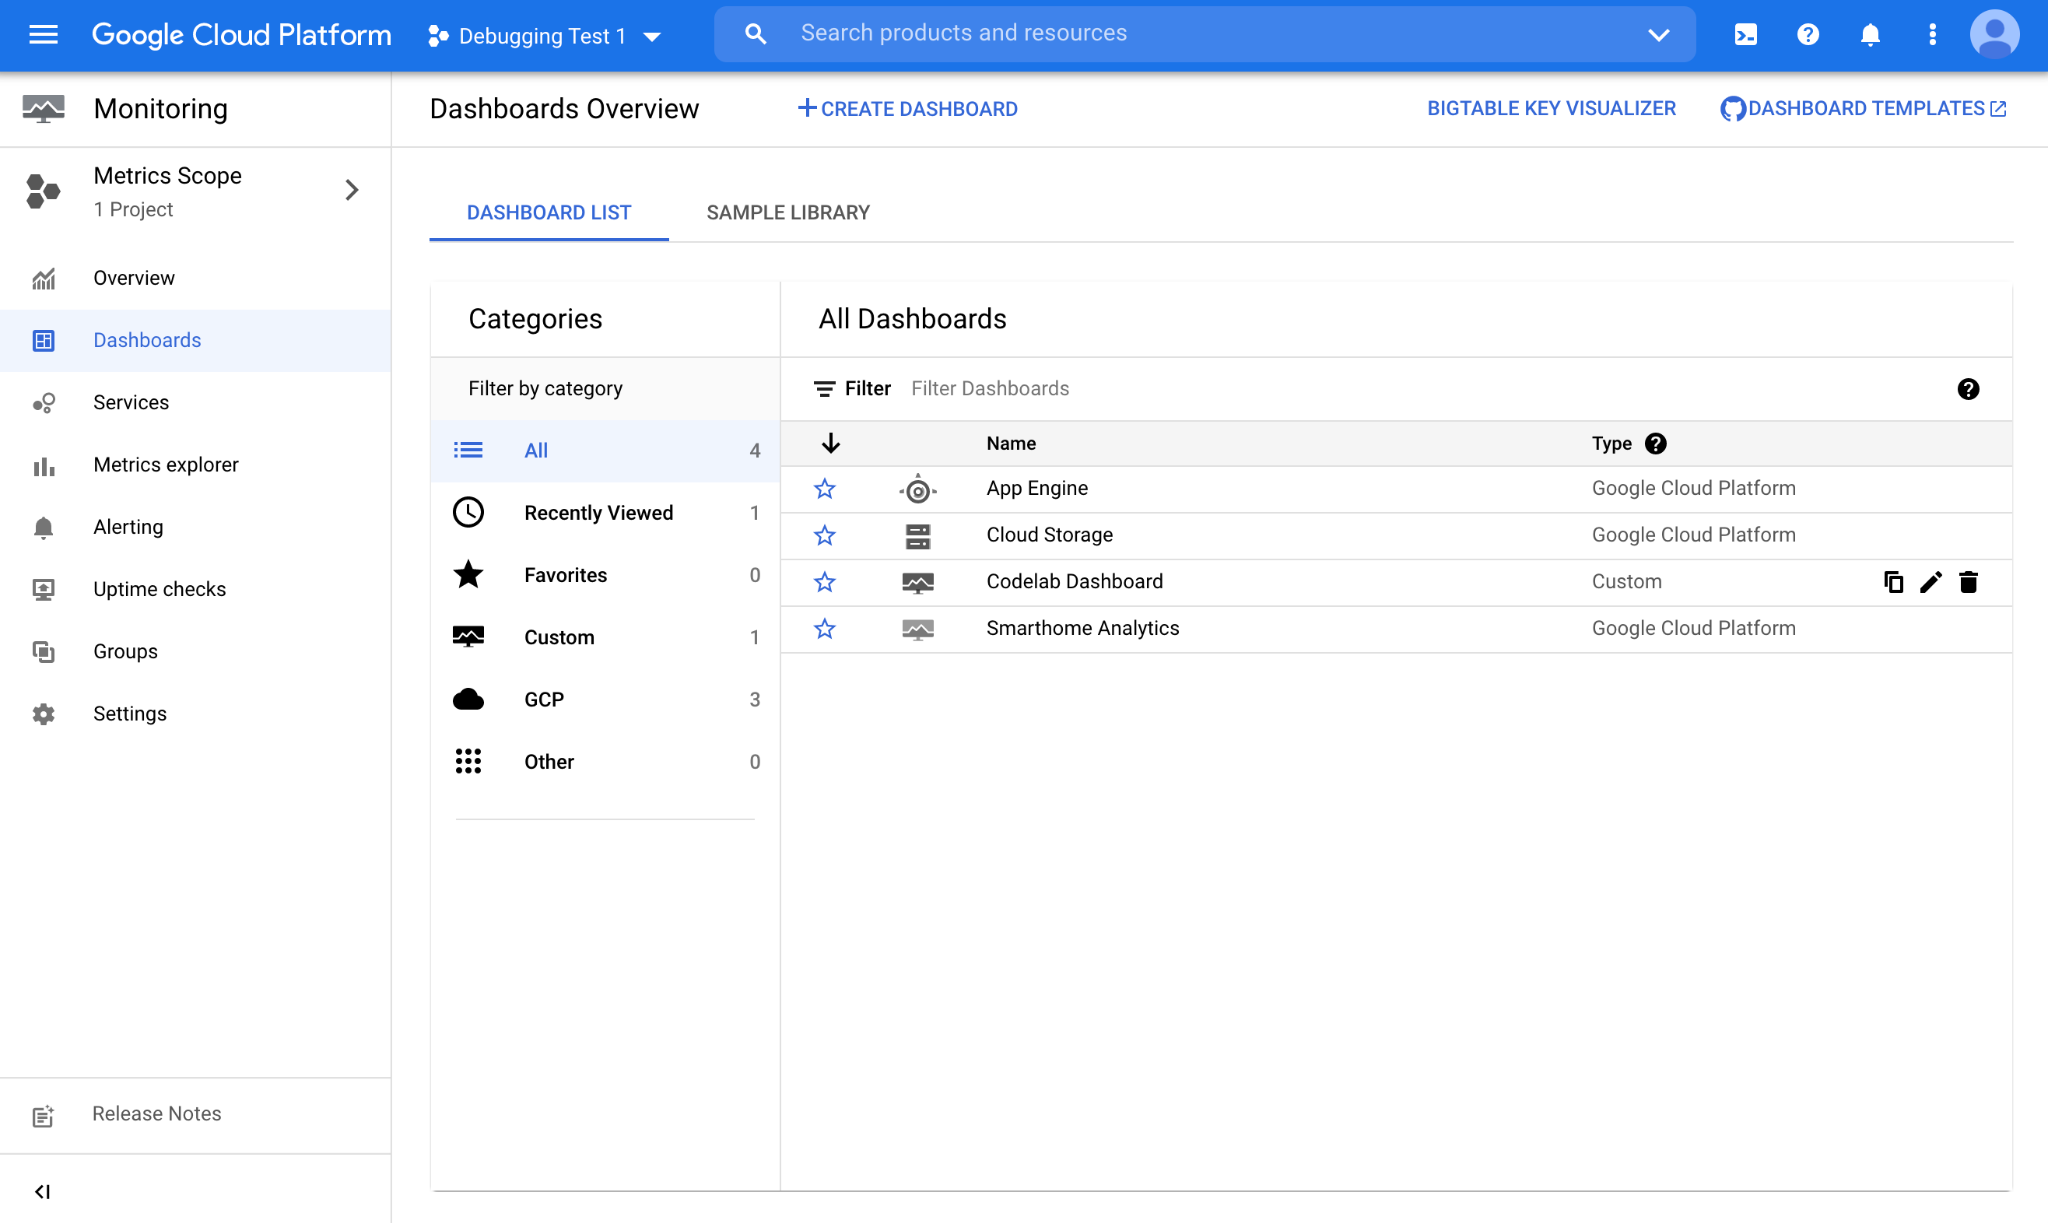
Once we save the chart in a dashboard, we can access it easily from there on. To access the list of dashboards available on your project, navigate to Operations > Monitoring > Dashboards.
We have saved our chart in a dashboard named "Codelab Dashboard". Opening it up will display the following view:
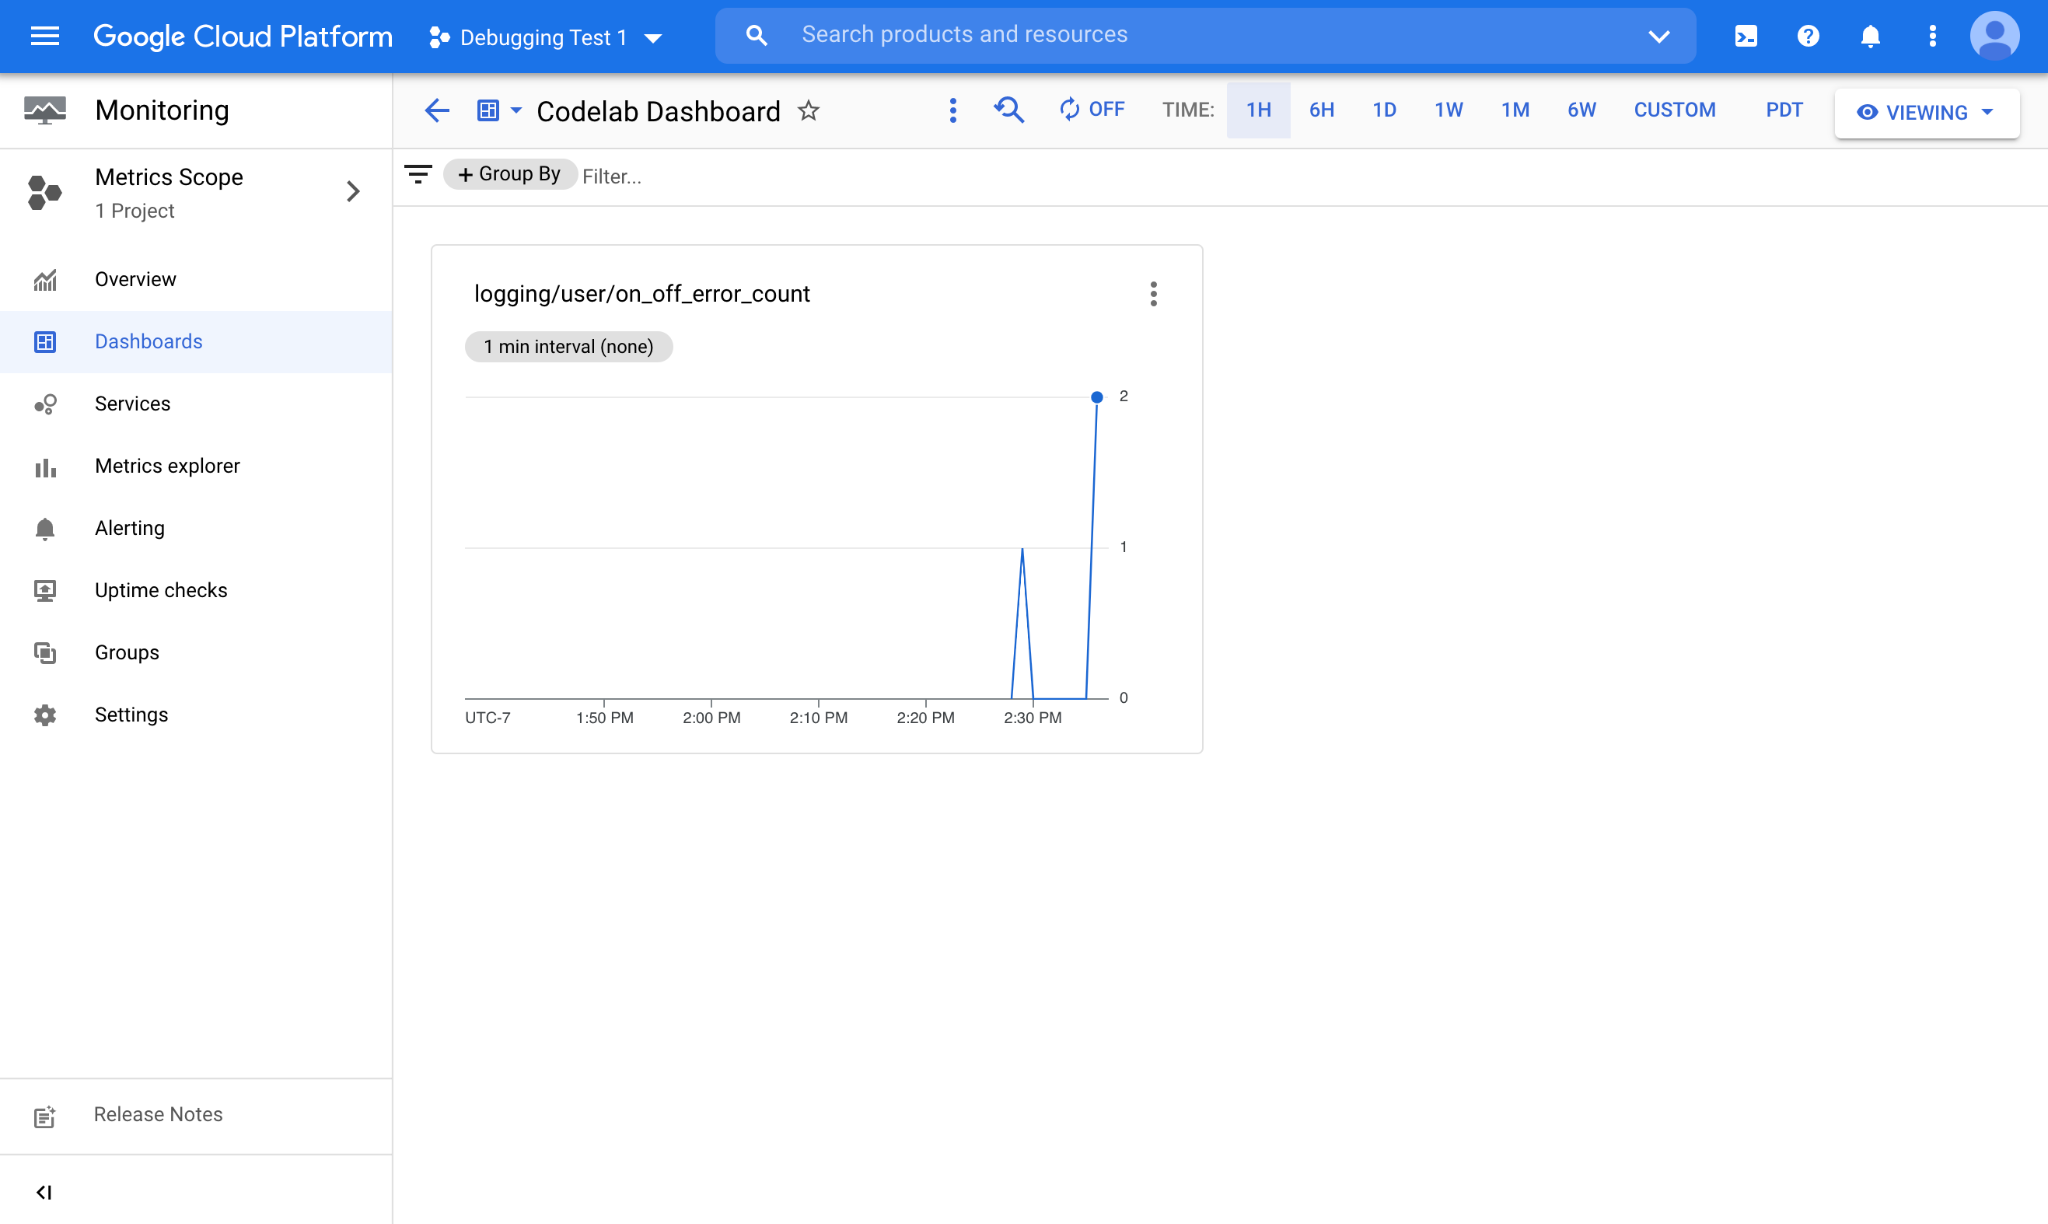
As you see the chart representing the log-based metric is displayed here, along with the newly collected data. Smart home logs are published to your project in realtime. When a new log is available, you will see it counted by your log-based metric immediately.
4. Congratulations
Congratulations! You successfully learned how to turn your queries into log-based metrics and save them into custom dashboards for monitoring.
Next steps
Building off this Codelab, try the following exercises and explore additional resources:
- Check out the Creating Distribution Metrics guide to create log-based metrics on numeric fields such as the latency.
- Review the Sample Query Library provided by Google Cloud to see some of the complex filters you can use for log-based metrics.