
1. Before you begin
This codelab is designed for Google Home Partners and Developers with Cloud Integrations to improve ecosystem quality and user experience.
What you'll learn
The Google Home Vitals Dashboard serves as the central source of truth for developers and partners to monitor the operational health of their Google Home integrations. In an ecosystem where user experience is defined by latency and reliability, Google Home Vitals is the self-service portal containing all the deep-dive analytics necessary to transition from reactive troubleshooting to proactive quality management.
- How your quality integration score is calculated
- How to read and use the dashboard
- How to debug poor quality metrics
What you'll need
- Have a Google Home Cloud Integration
Setup
How to navigate to Google Home Vitals Dashboard:
- Open Google Cloud Platform
- Monitoring > Dashboard
- Click on "Google Home Vitals (Cloud)" Dashboard
2. How to Read the Dashboard
Quality Score Calculation – "Good" vs. "Poor" Standard
The dashboard explains the breakdown for quality scoring. Quality scores are assigned on a device type granularity. For a device type integration to be considered GOOD, it must meet four concurrent criteria:
- Global Success Rate: Overall Partner-to-Google calls success rate must be >=99.5%.
Note: Failure to meet the Global Success Rate (>=99.5%) results in an automatic POOR rating across the entire project, regardless of individual device performance. - Command Reliability: QUERY and EXECUTE success rates must be >=99.5% for every device type.
- Responsive Latency: 90th percentile latency for QUERY and EXECUTE must be <=1000ms for every device type.
- State Integrity: State Accuracy must be >=99.5%.
Why these Metrics Matter
- Global Success Rate: Partner-to-Google calls at the integration-level measures the health of calls from your cloud to Google. A >= 99.5% success rate ensures Google Home uses correct device states. Some examples include making sure that devices are added and removed, that automations trigger, and that history events appear in the Google Home app's Activity tab.
- Command Reliability: QUERY and EXECUTE success rates are measured at the device type level, a >=99.5% success rate ensures your user's commands are fulfilled correctly (i.e avoids Assistant responses such as "I can't reach the device" or incorrectly confirming a command which wasn't fulfilled).
- Responsive Latency: QUERY and EXECUTE latencies are also measured at the device type level, a <=1000ms latency per device type ensures your user doesn't have to wait too long to get to their desired action (i.e. waiting a few seconds for their light to turn off).
- State Integrity: State Accuracy Measure the accuracy of the state stored in Google systems and used to serve user queries. If these numbers are low, then users may see incorrect results for your devices when they view the state of your device or use AI features like Ask Home. Automations may not fire and history entries may not appear in Activity at the right time.
How to Read the Dashboard
Begin in the Quality Score Metrics section, which serves as the primary health indicator for your integration. A GOOD device-level rating is contingent upon all metrics in this section meeting the GREEN success criteria. Detailed technical requirements and metric definitions are available in the Developer Center documentation.
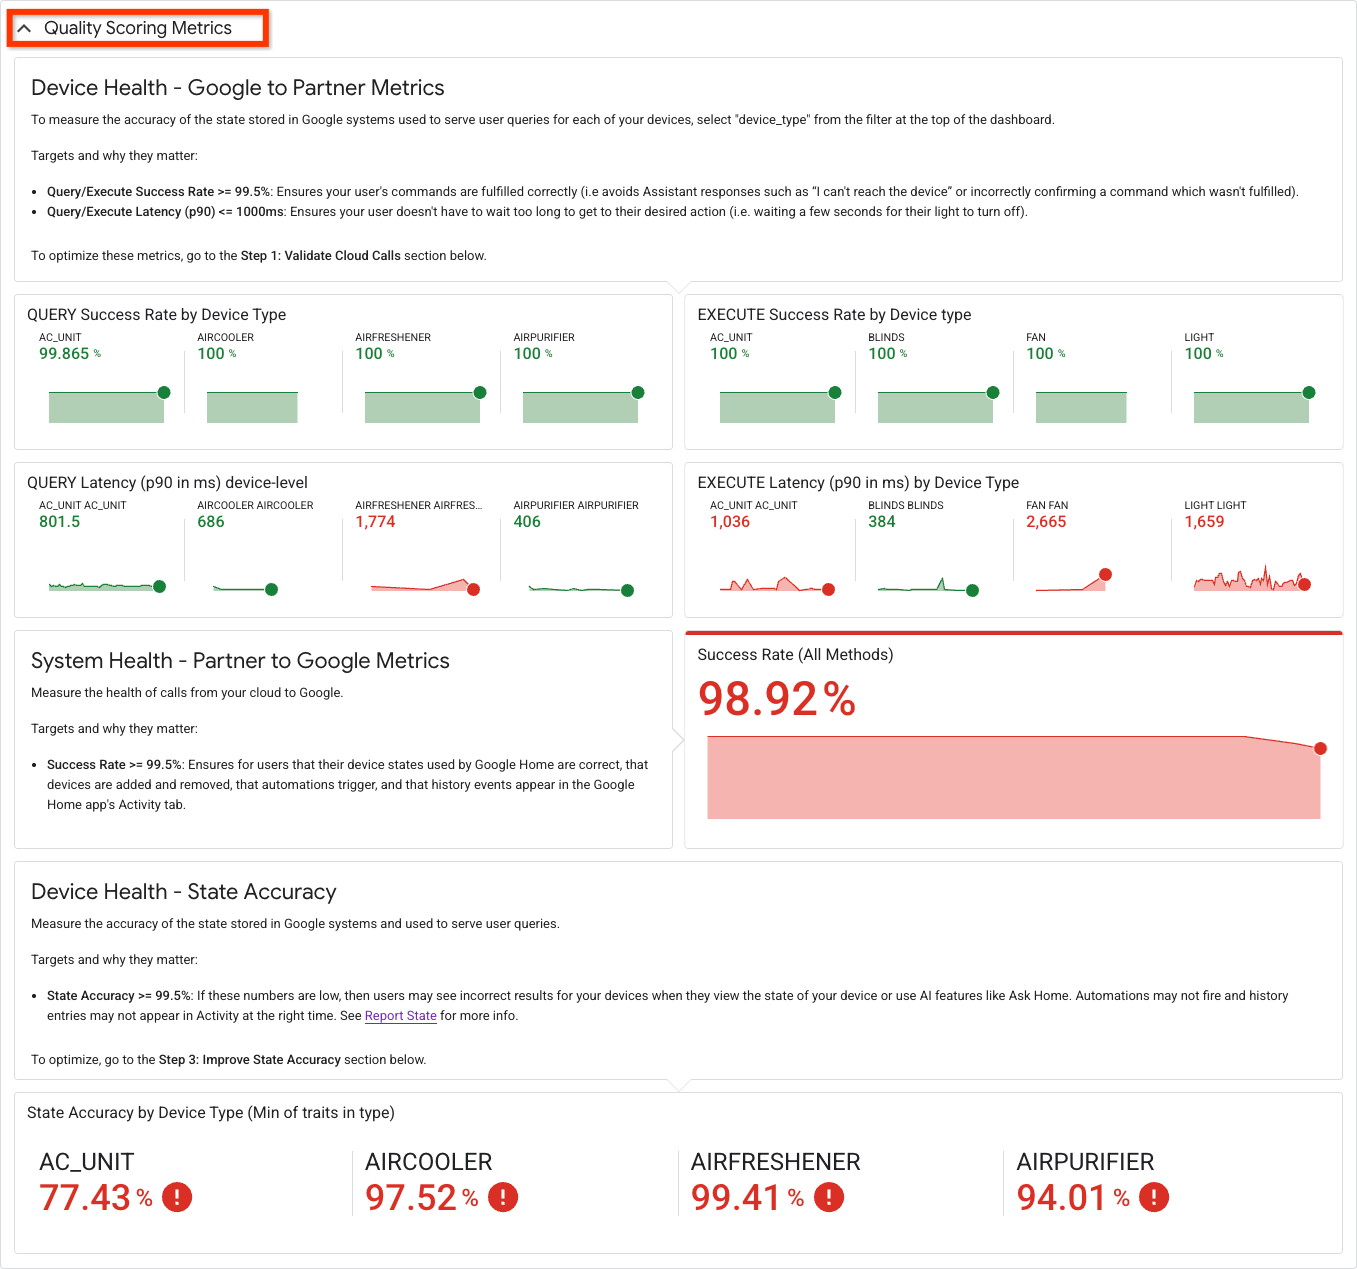
The "Quality Metrics Score" section at the top of the Google Home Vitals dashboard reflects the metrics used to calculate your integration quality score.
Legend
- GREEN (GOOD): the metric meets the quality threshold.
- RED (POOR): the metric does not meet the quality threshold.
Example
In the below example, you can see that the AC_UNIT device type meets the quality criteria in the QUERY and EXECUTE Success Rate as well as the QUERY Latency section, but failing the EXECUTE Latency bar (red). This means that commands are succeeding at a passing rate, but EXECUTE latency is 36ms too slow. The System Health section shows a failing 98.92% rate for aggregated methods across the integration, which means there is room for improvement to ensure the accuracy of users' device states to Google Home. This means 1.08% of calls (DeleteAgentUser, Query, ReportStateAndNotification, RequestSyncDevices, or Sync) are returning response codes that do not equal 2xx or 5xx (eg. 404 errors). The last metric used to measure pass/fail quality for the AC_UNIT device type is state accuracy. In this example, we see a 77.43% success rate, which means users are likely seeing inaccurate results for devices. With these three metrics, the overall score for AC_UNIT is POOR and below the quality threshold.
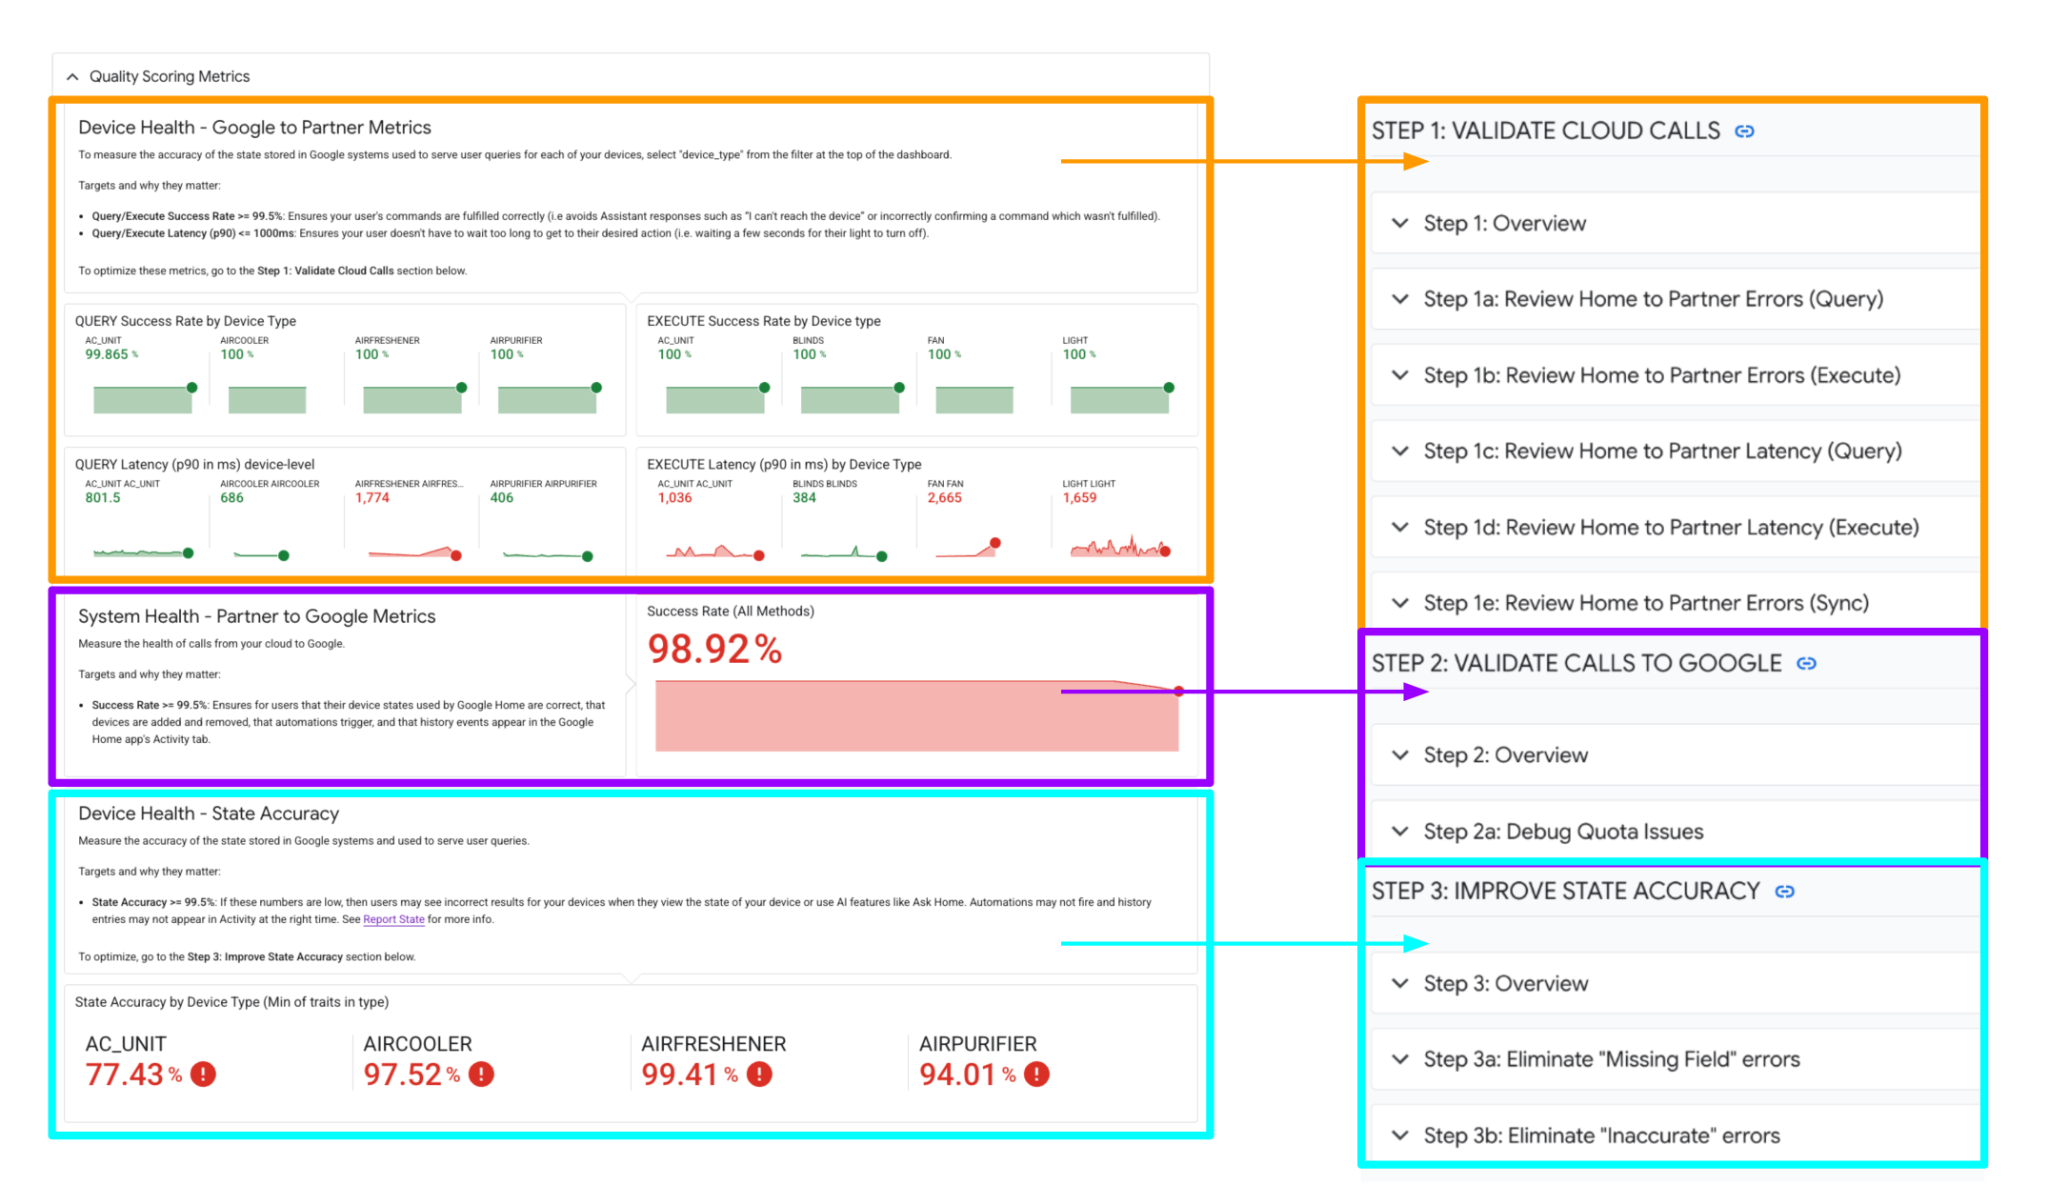
Each of these quality calculations corresponds to a debugging section below. Open up the collapsed steps for further debugging.
To debug QUERY/EXECUTE success rates and latencies, go to "Step 1: Validate Cloud Calls".
To debug Partner to Google success rates, go to "Step 2: Validate Calls to Google".
To debug State Accuracy for each device type, go to "Step 3: Improve State Accuracy".

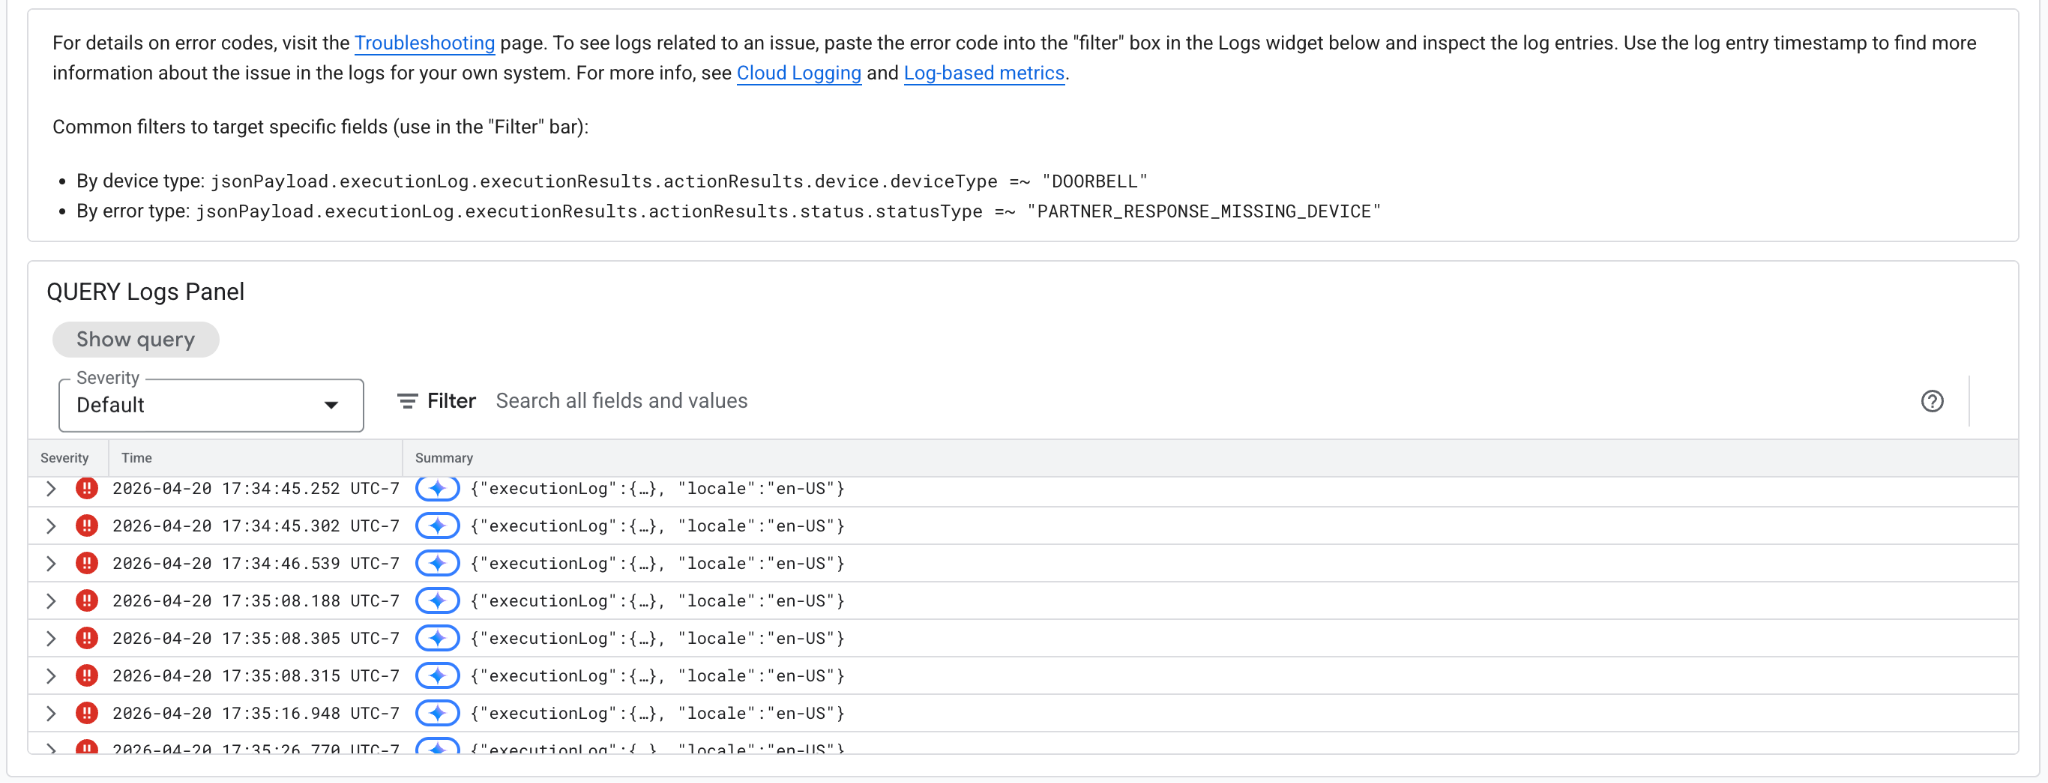
3. Debugging Step 1: Validate Cloud Calls
Step 1: Overview
This section focuses on Cloud Calls — the metrics measuring the health of communications from Google to your cloud backend (also known as Google-to-Partner metrics). This includes commands like Query, Execute.
We track success rates and latencies for QUERY and EXECUTE (which factor into your device-type quality scores).
The below overview shows the aggregate QUERY, EXECUTE success rates and errors at the integration level. Steps 1a-1d show the breakdown for these metrics on the device type/trait level. 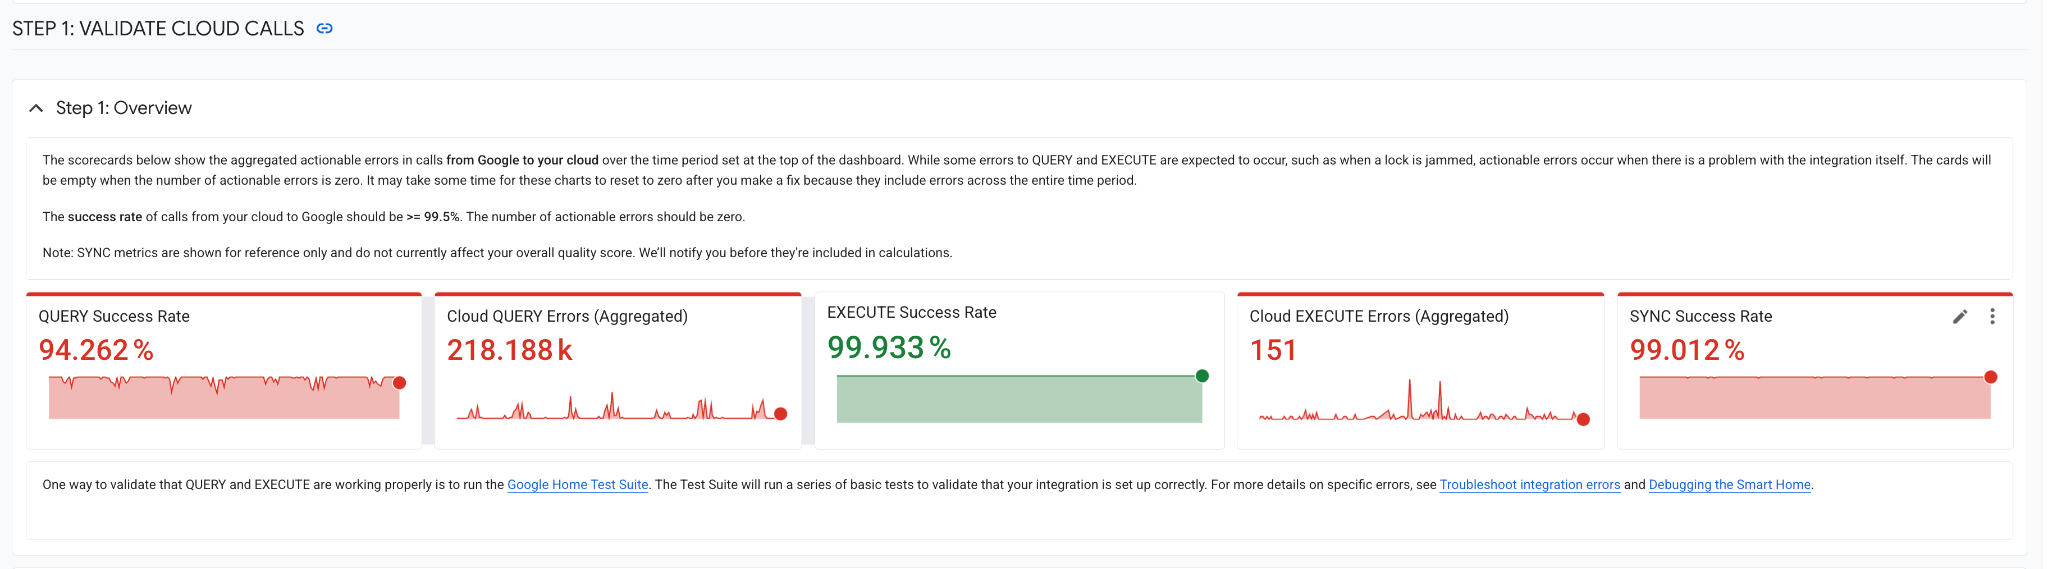
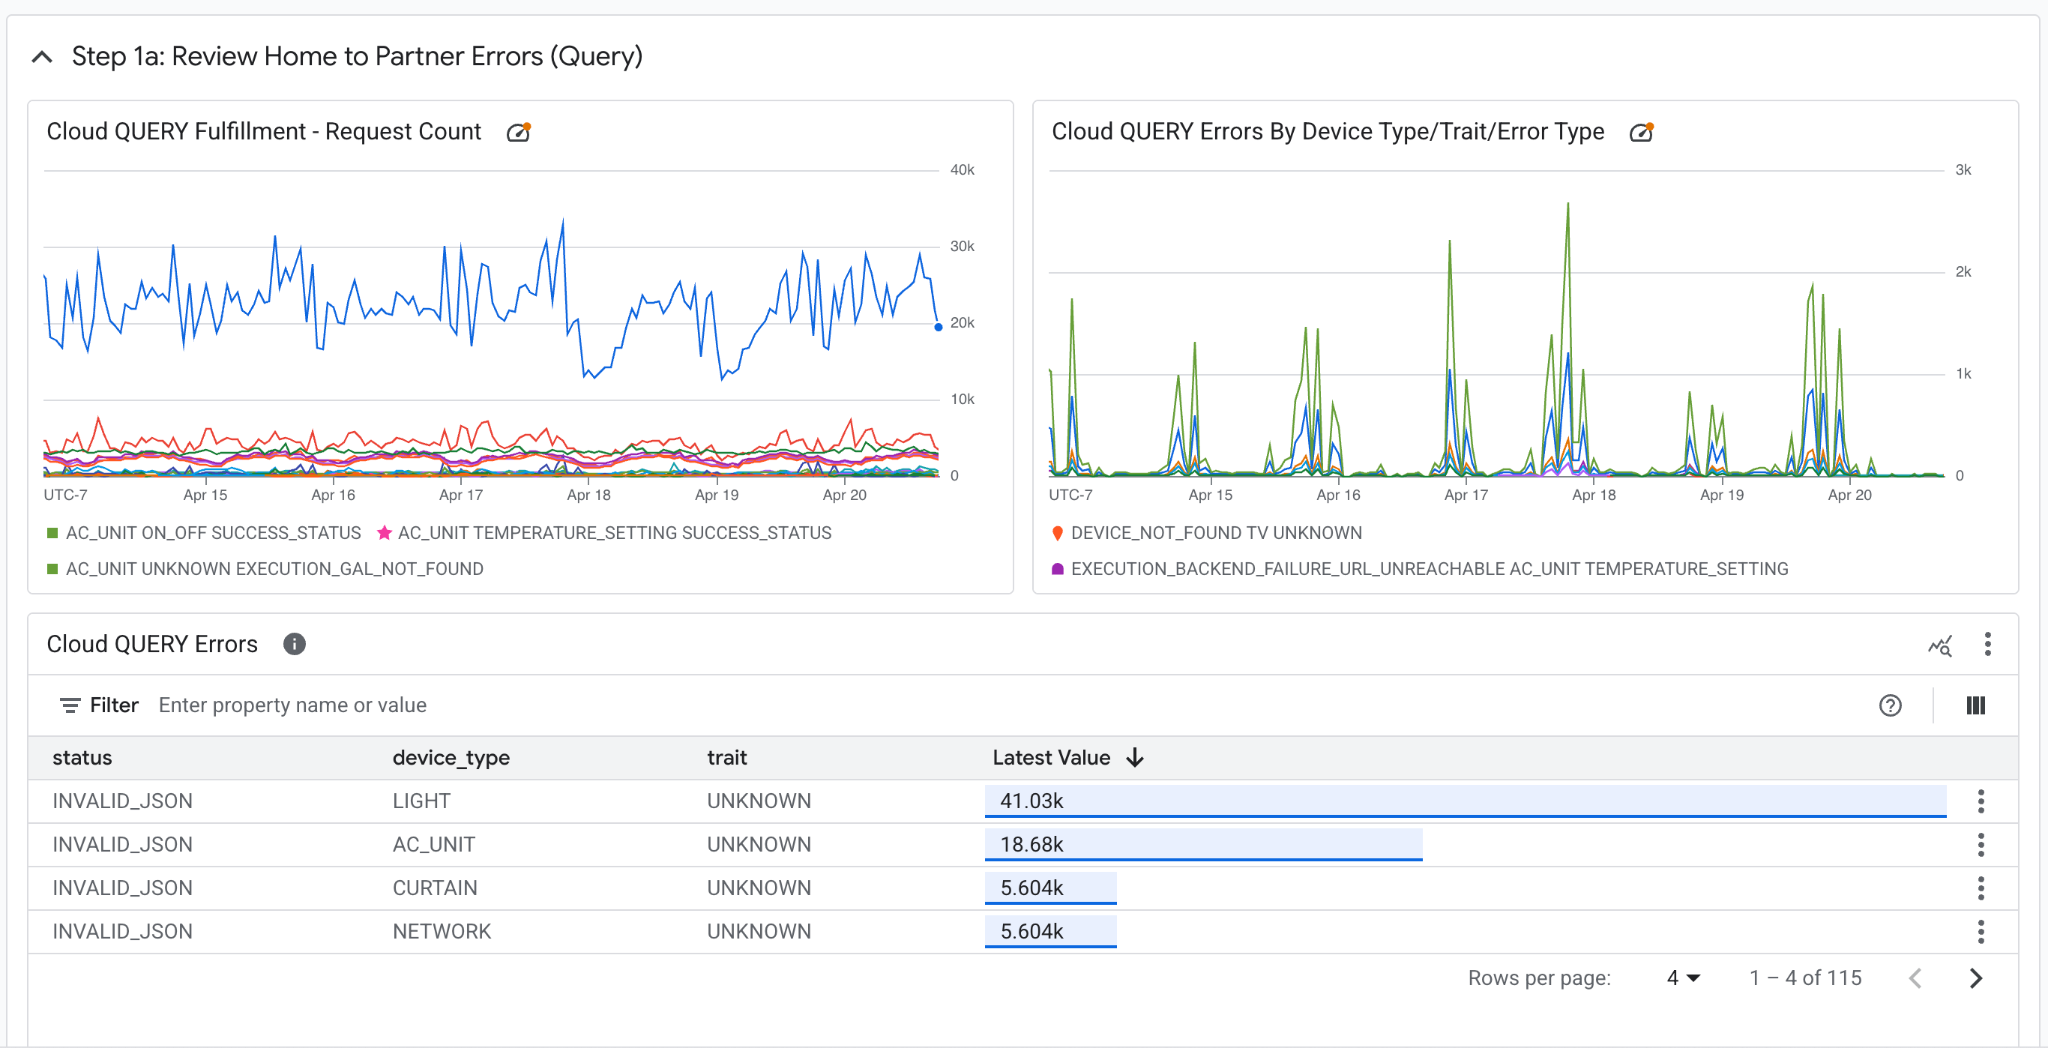
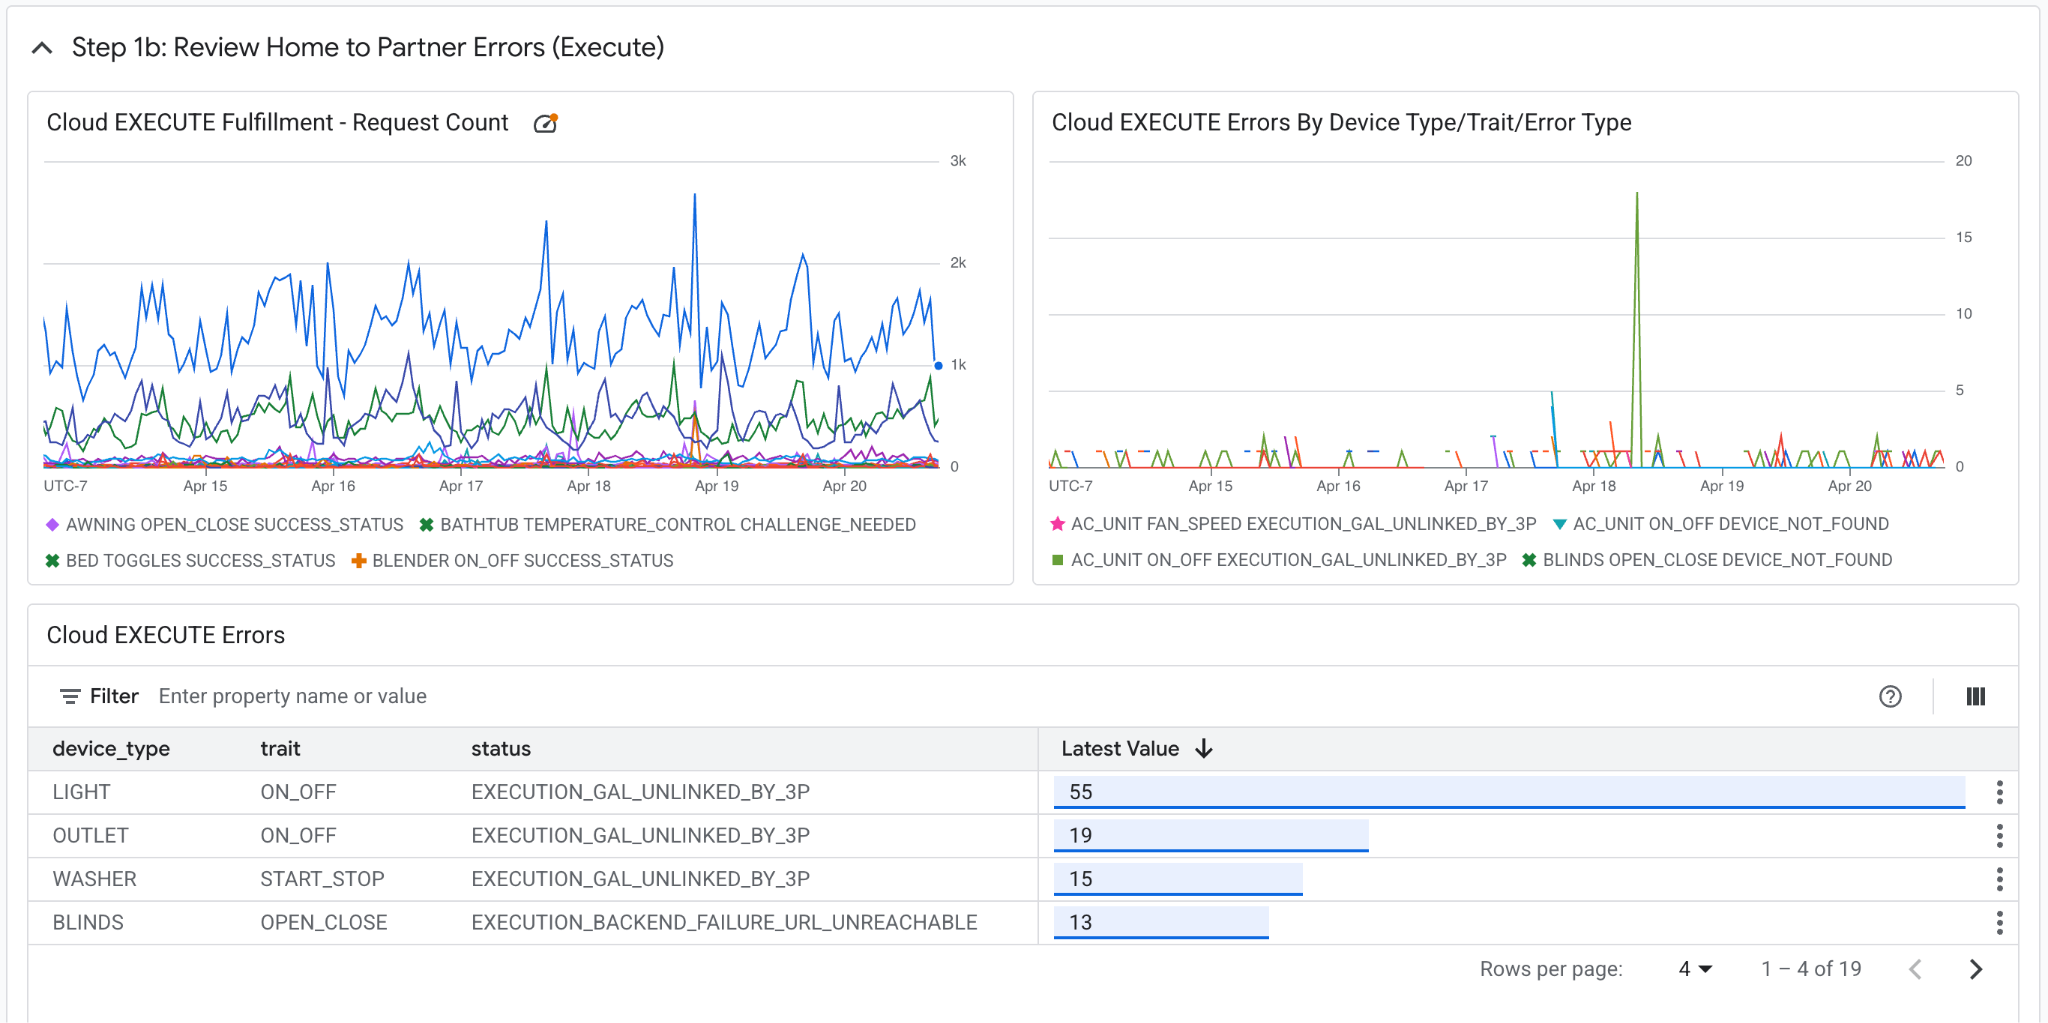
Steps 1a and 1b show the trend of fulfillment request count, error counts over time and specific error statuses.
Step 1a: Review Query Errors
Step 1b: Review Execute Errors
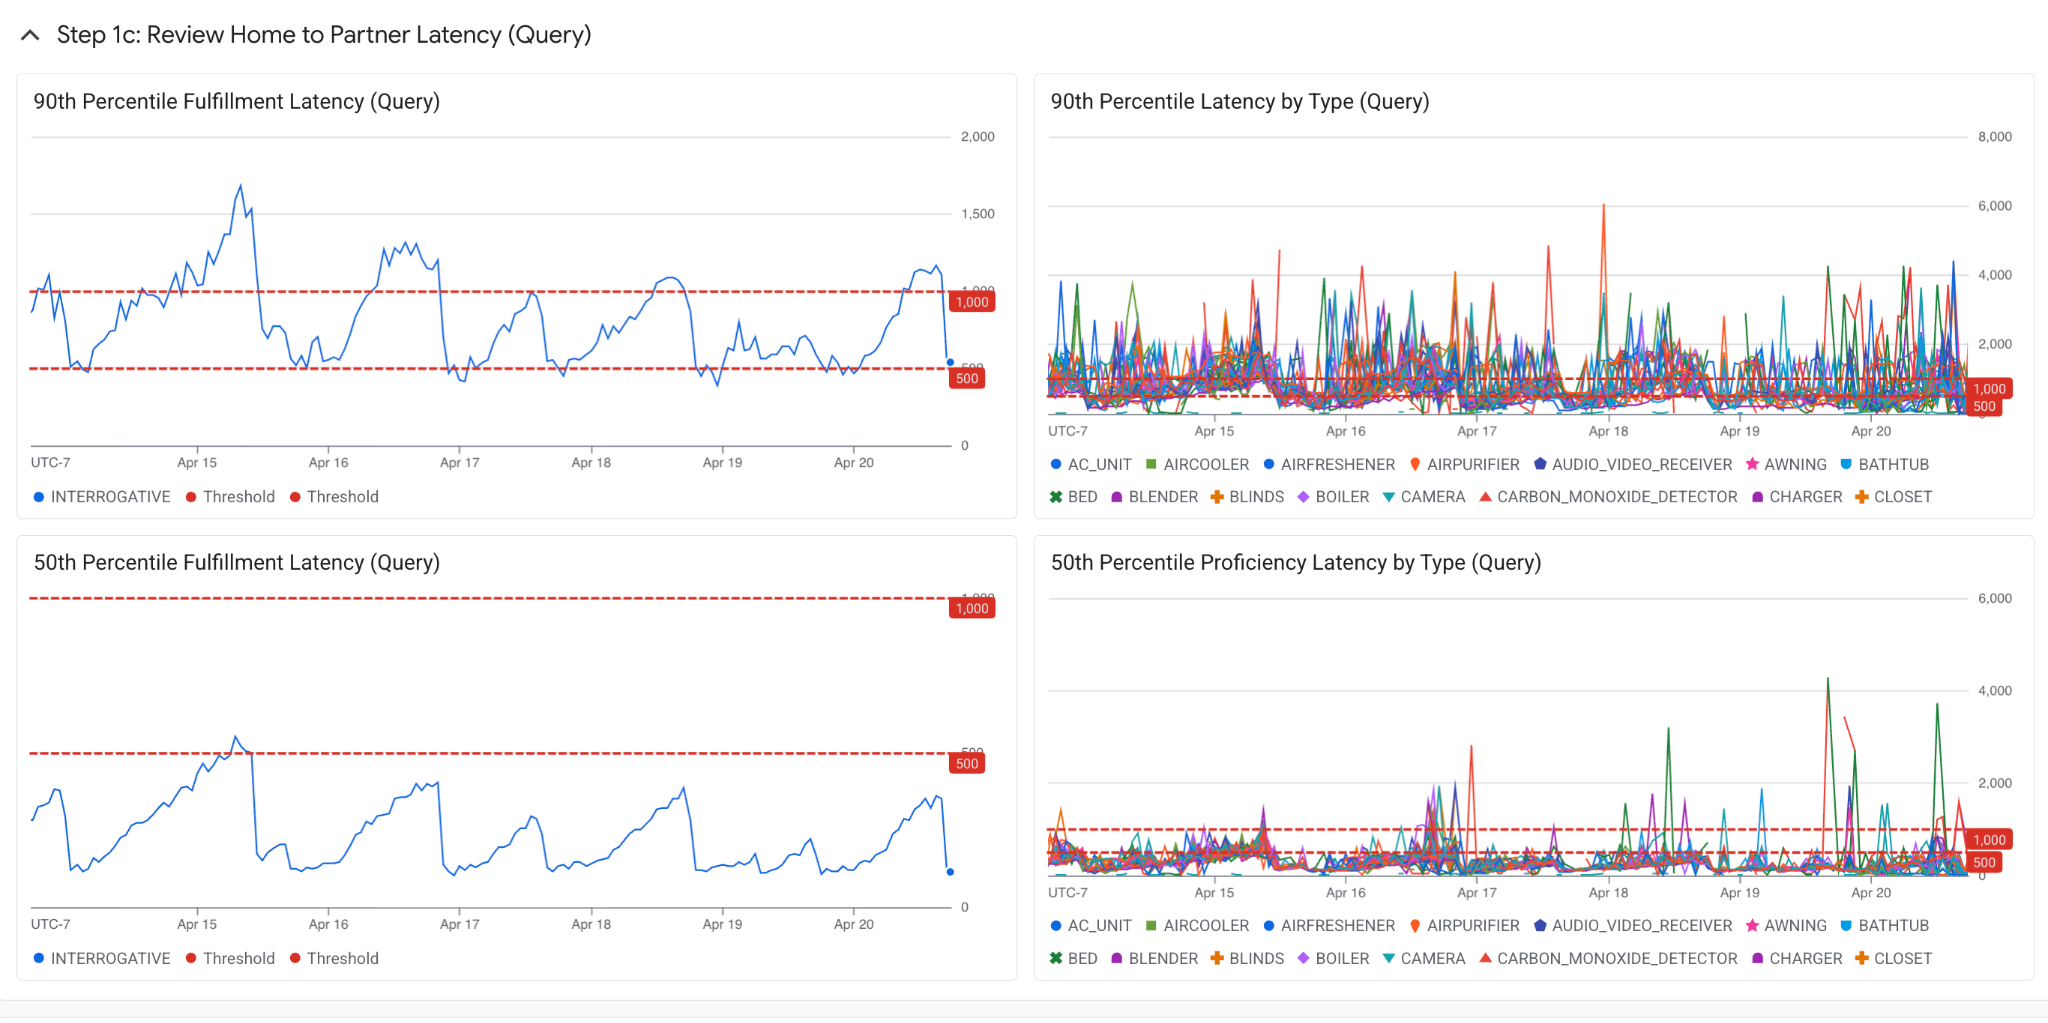
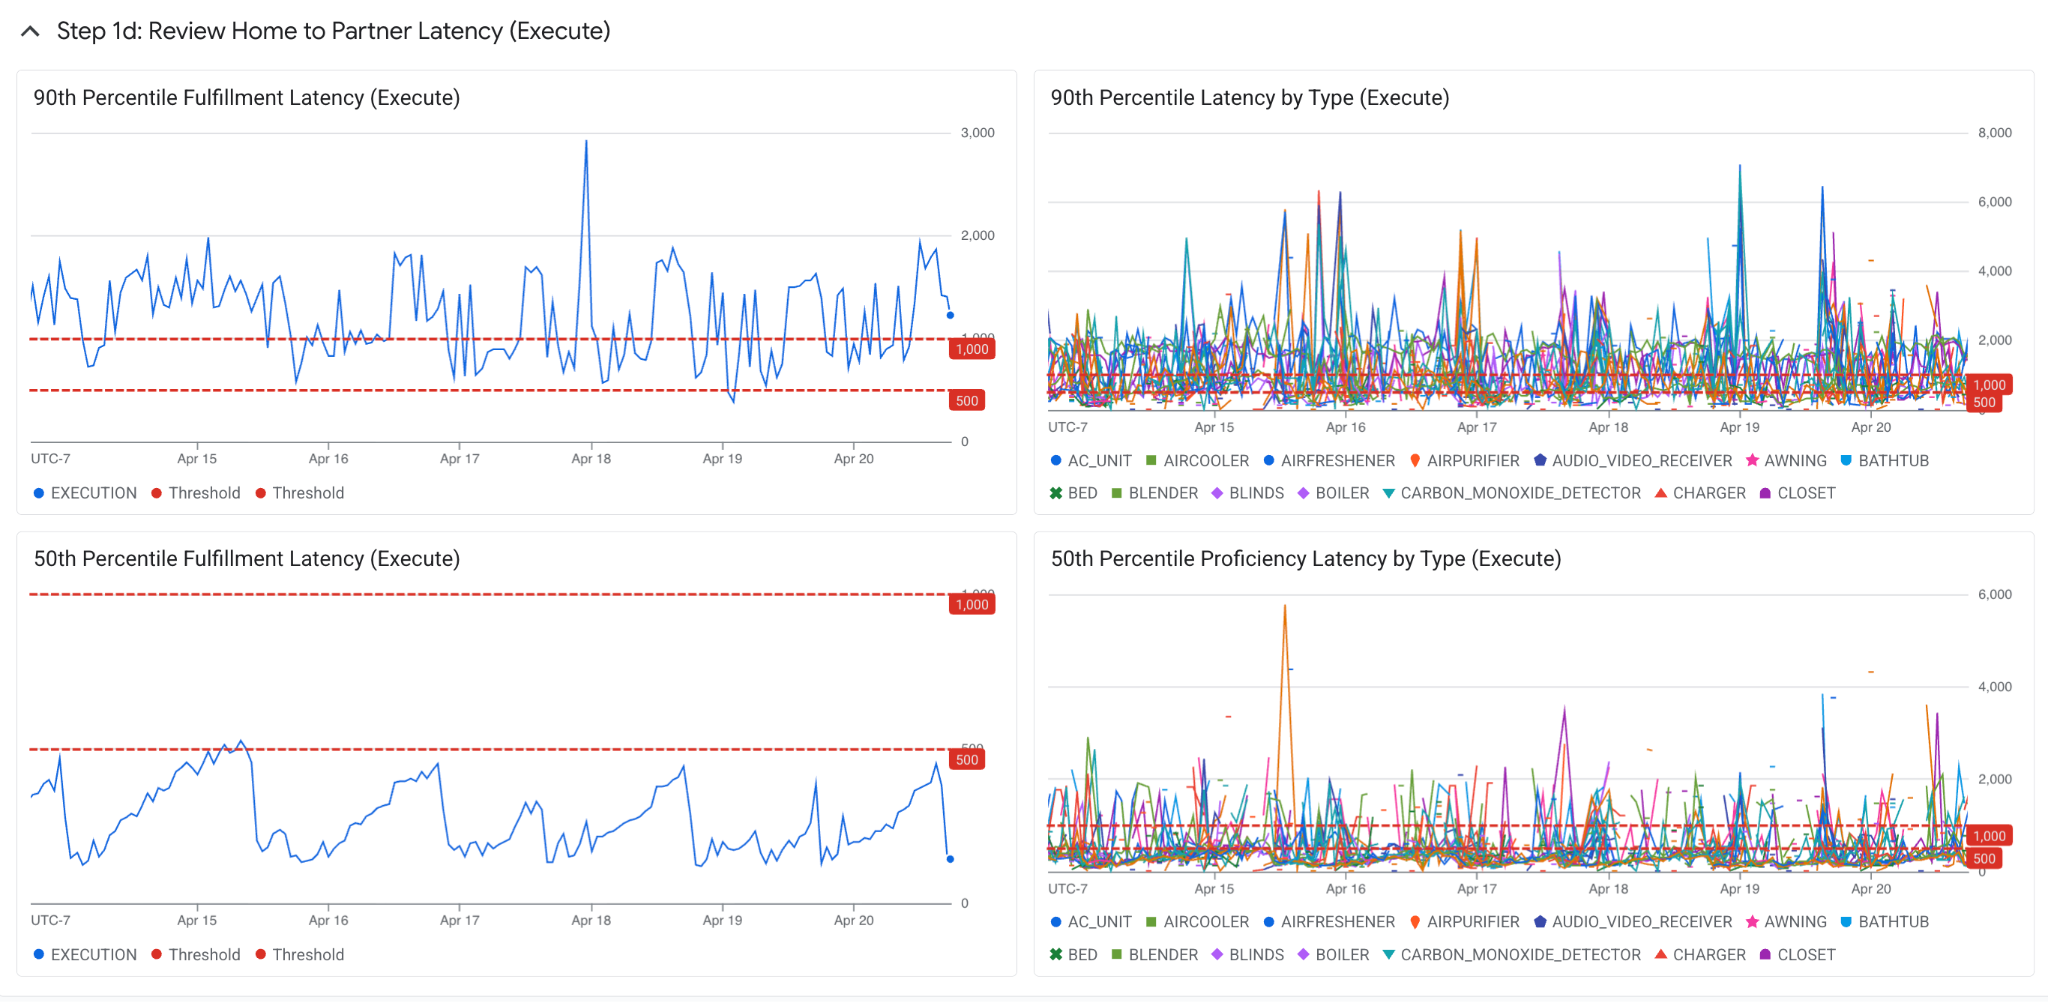
Steps 1c and 1d show the breakdown of 90th and 50th percentile for these metrics as well on both the integration level and the device type level.
Step 1c: Review Query Latency
Step 1d: Review Execute Latency
4. Debugging Step 2: Validate Calls to Google
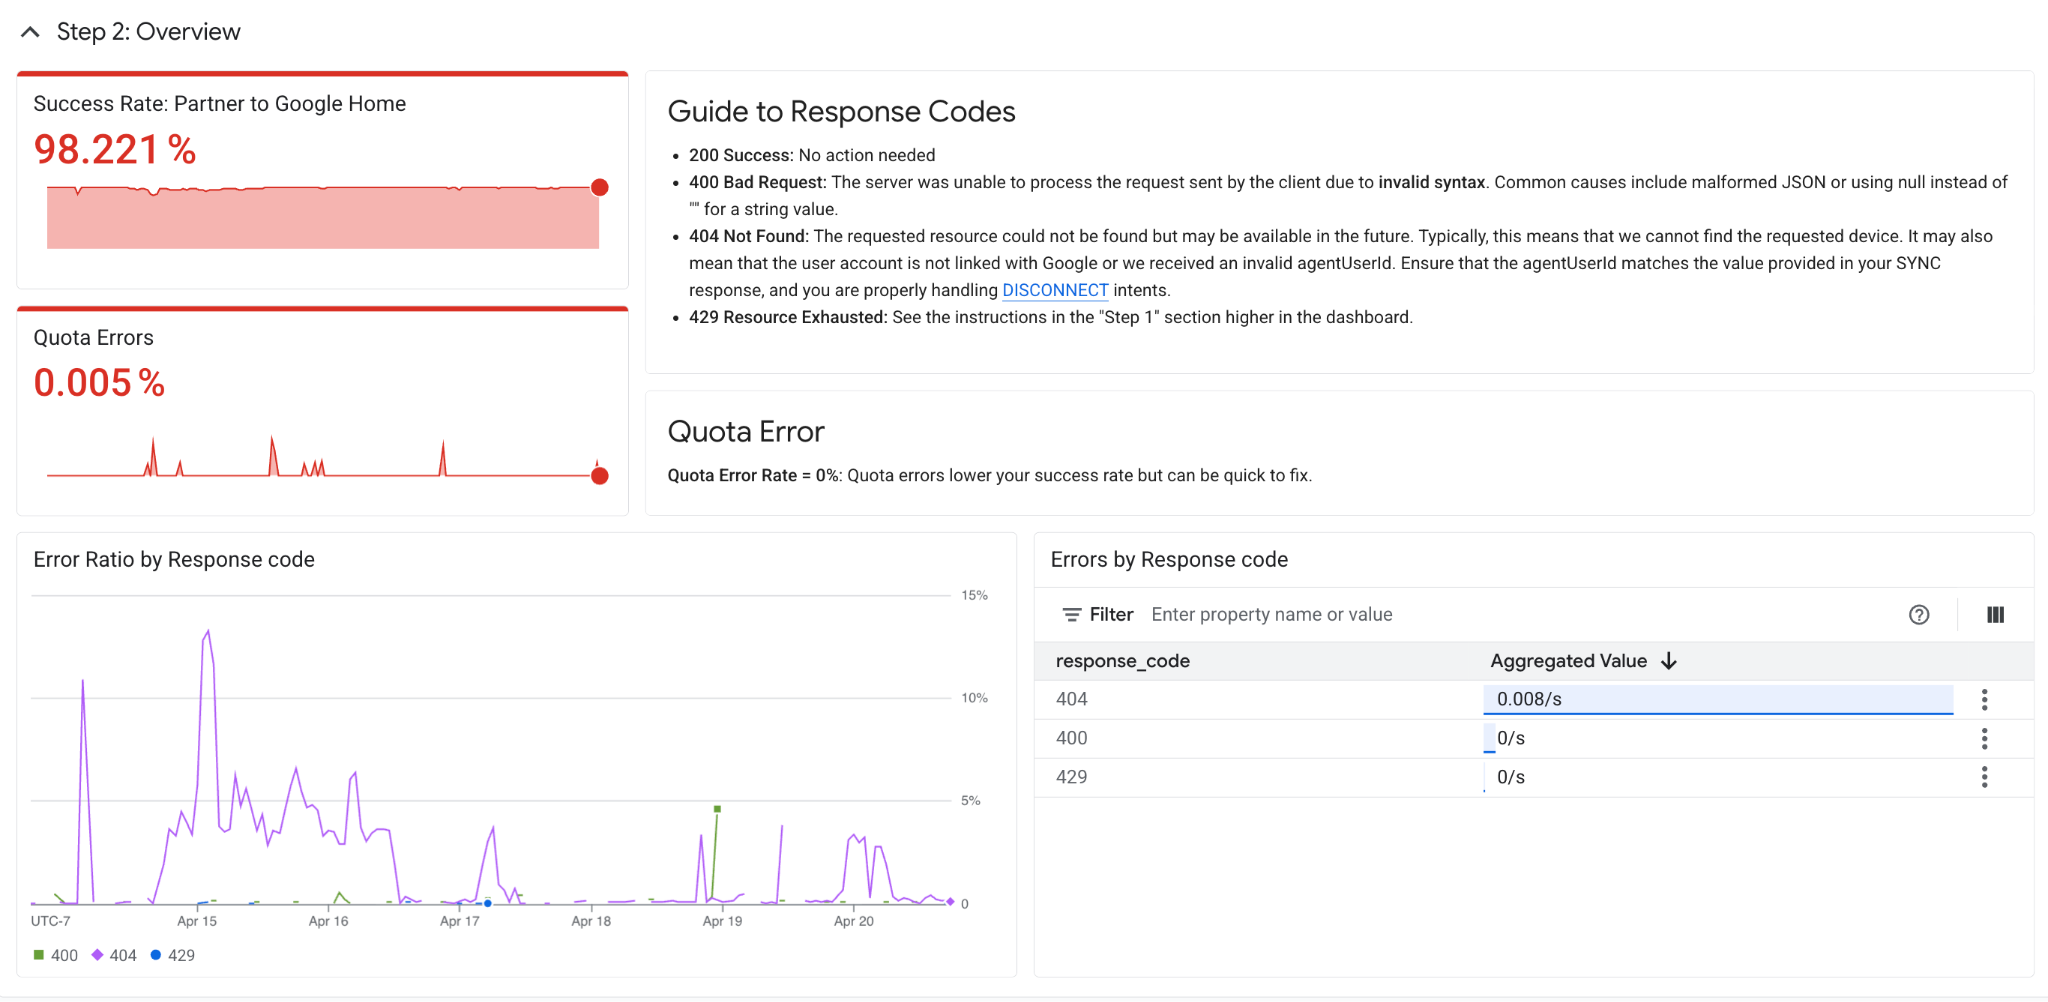
Step 2: Overview
After debugging calls from Google to partner, this second step covers debugging calls from partner cloud to Google. This section covers metrics at the partner-integration level, not device type level – this includes response codes such as 400 Bad Request, 404 Not Found, and 429 Resource Exhausted.
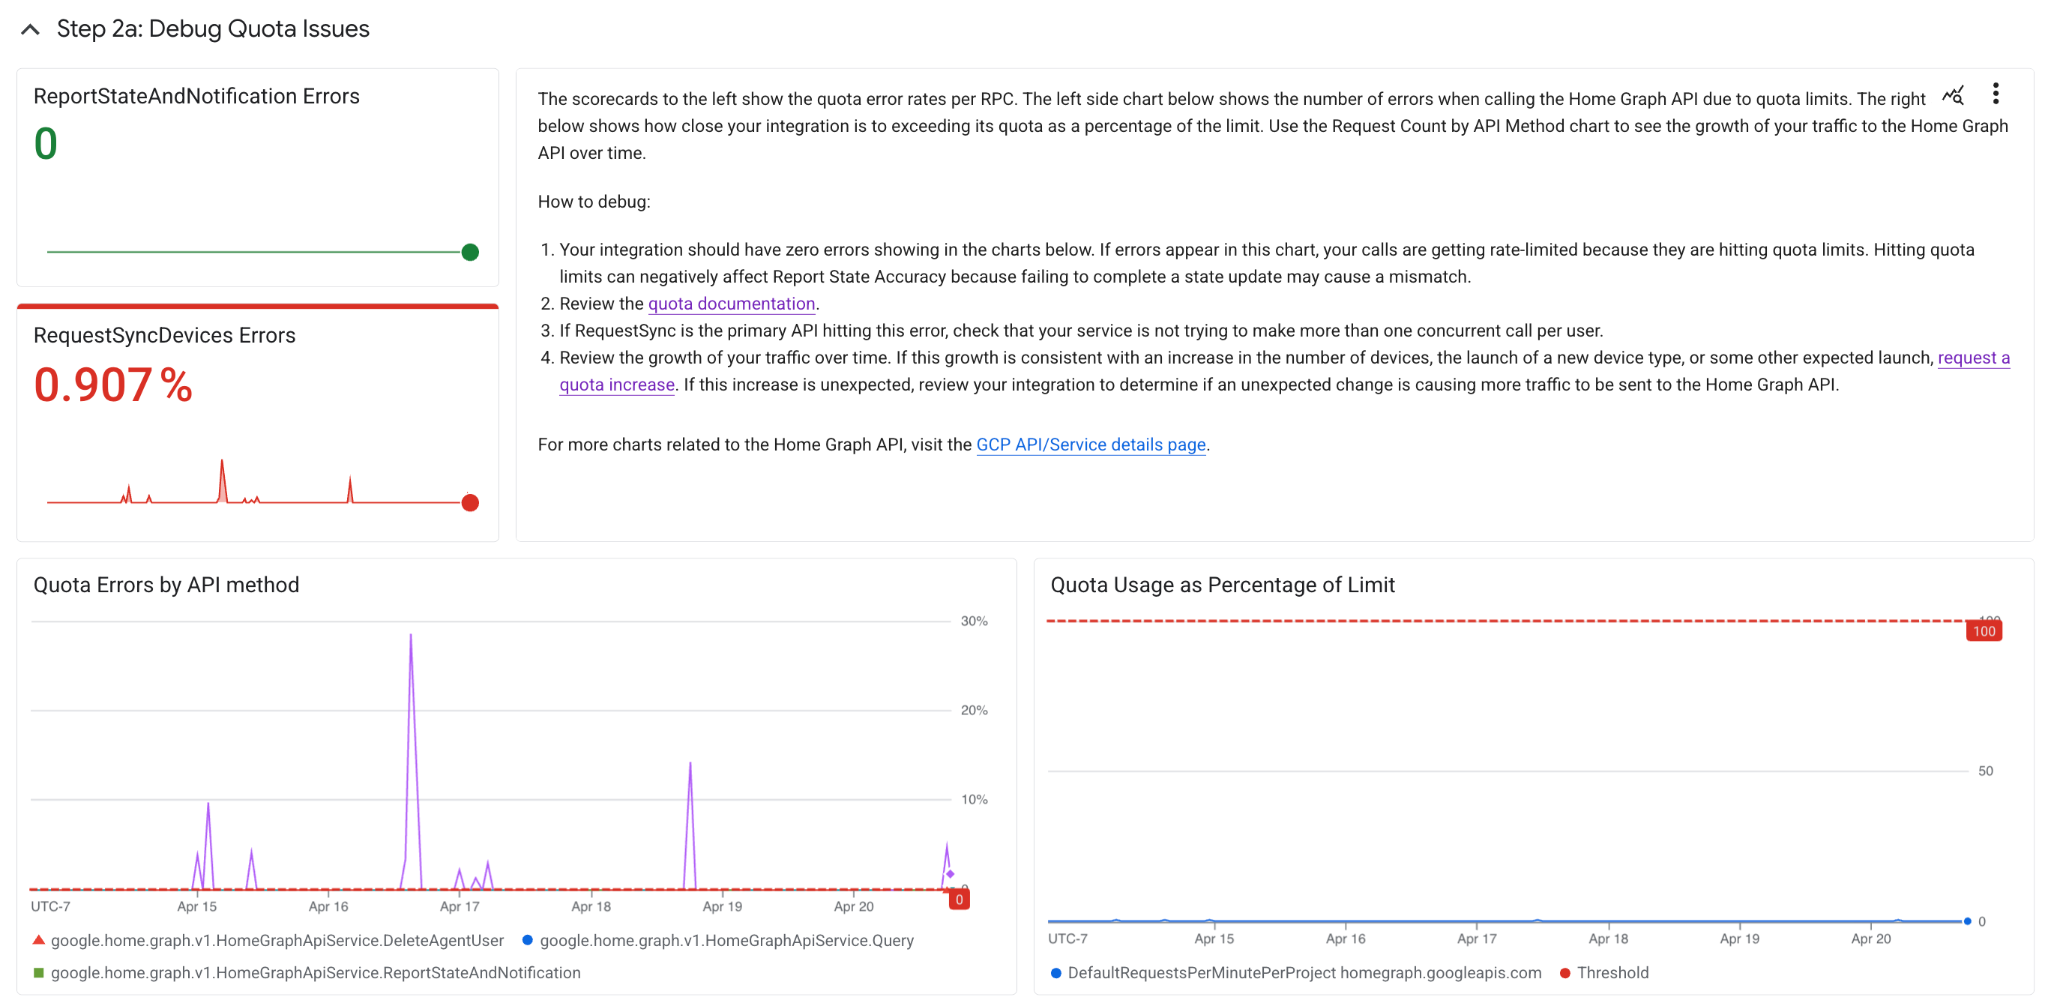
Step 2a: Debug Quota Issues
Google Home limits resource allocation and use and enforces appropriate quotas on a per-project basis. Google applies the default limit of 6,000 requests per 60 seconds to the aggregate of your query, delete, Report State, and asynchronous request sync API calls, on a per Cloud-to-cloud integration basis.
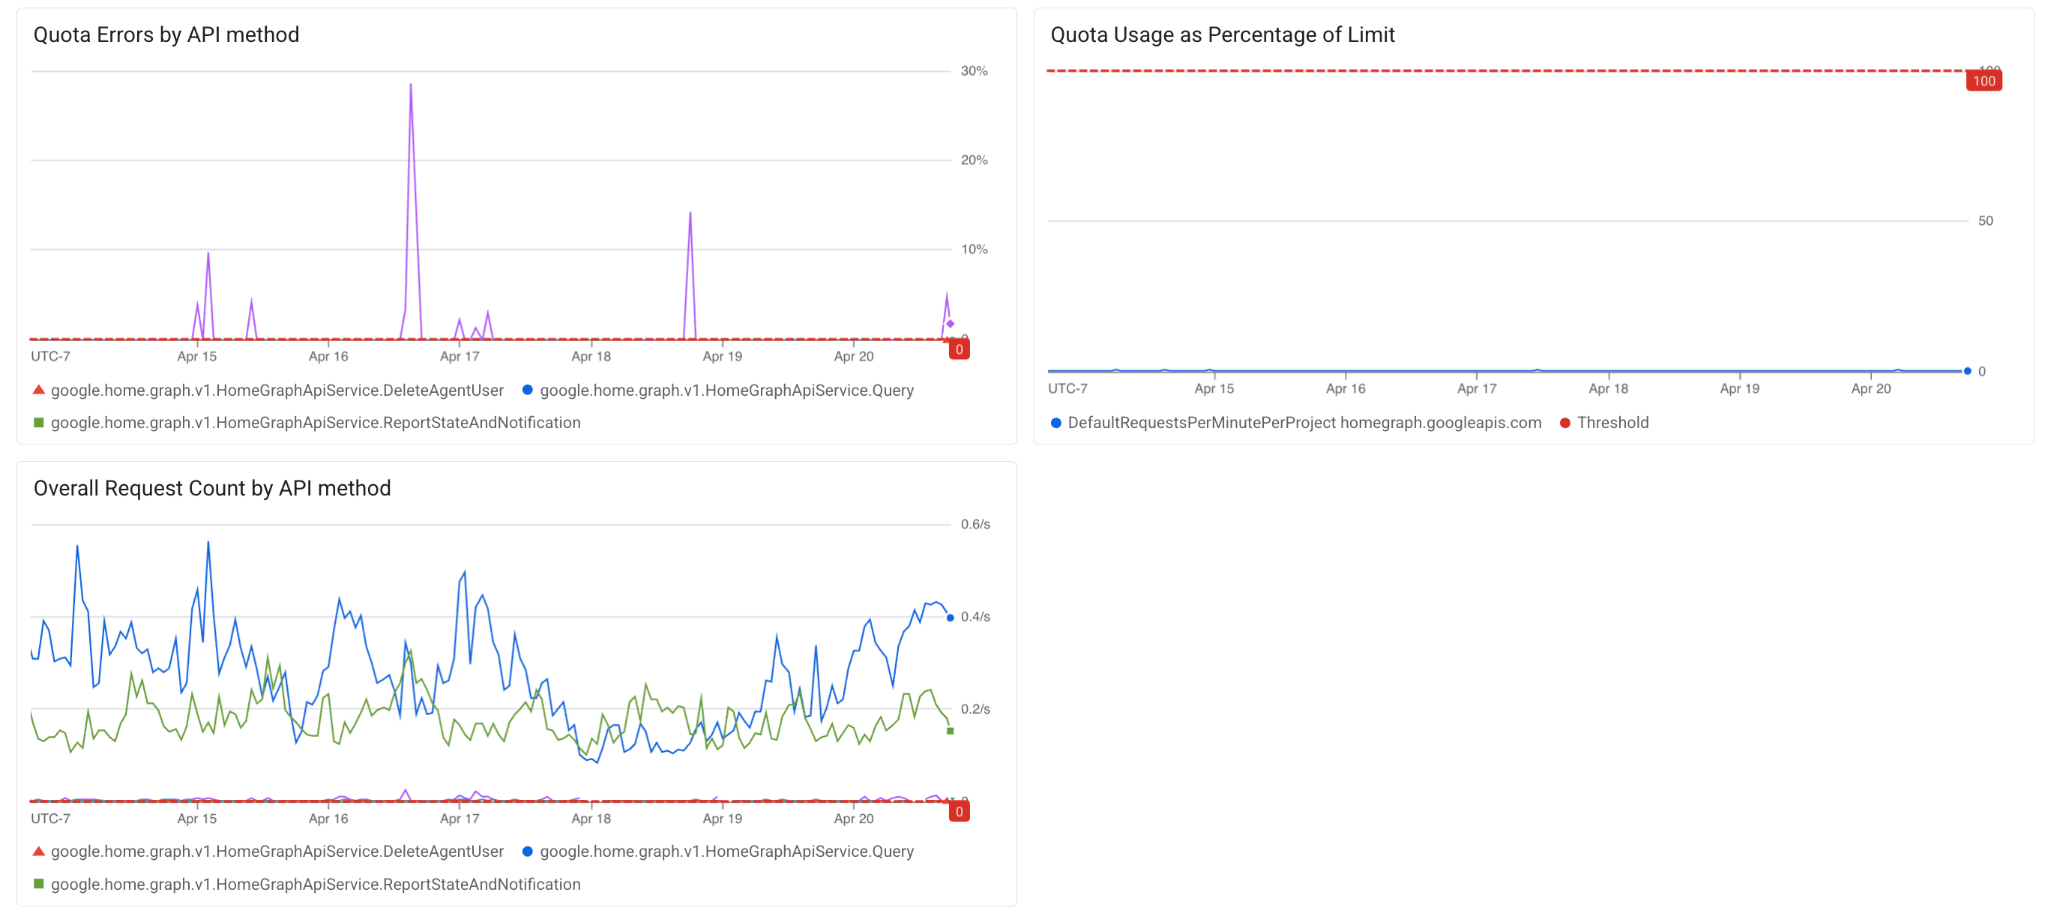
Hitting quota issues can negatively affect Report State Accuracy because failing to complete a state update may cause a mismatch. Below are charts with breakdowns specifically showing Report State and Request Sync Errors, API method breakdown of count and errors as well as percentage of quota usage. If these charts are showing an unexpected increase in traffic, review your integration to determine if a change is causing more traffic to be sent to the Home Graph API.
In some scenarios, such as natural growth of traffic over time (eg. growth is consistent with an increase in the number of devices, the launch of a new device type, or some other expected launch) increasing quota for your integration may be appropriate. To request an increase in quota, follow the steps on our developer documentation.
5. Debugging Step 3: Improve State Accuracy
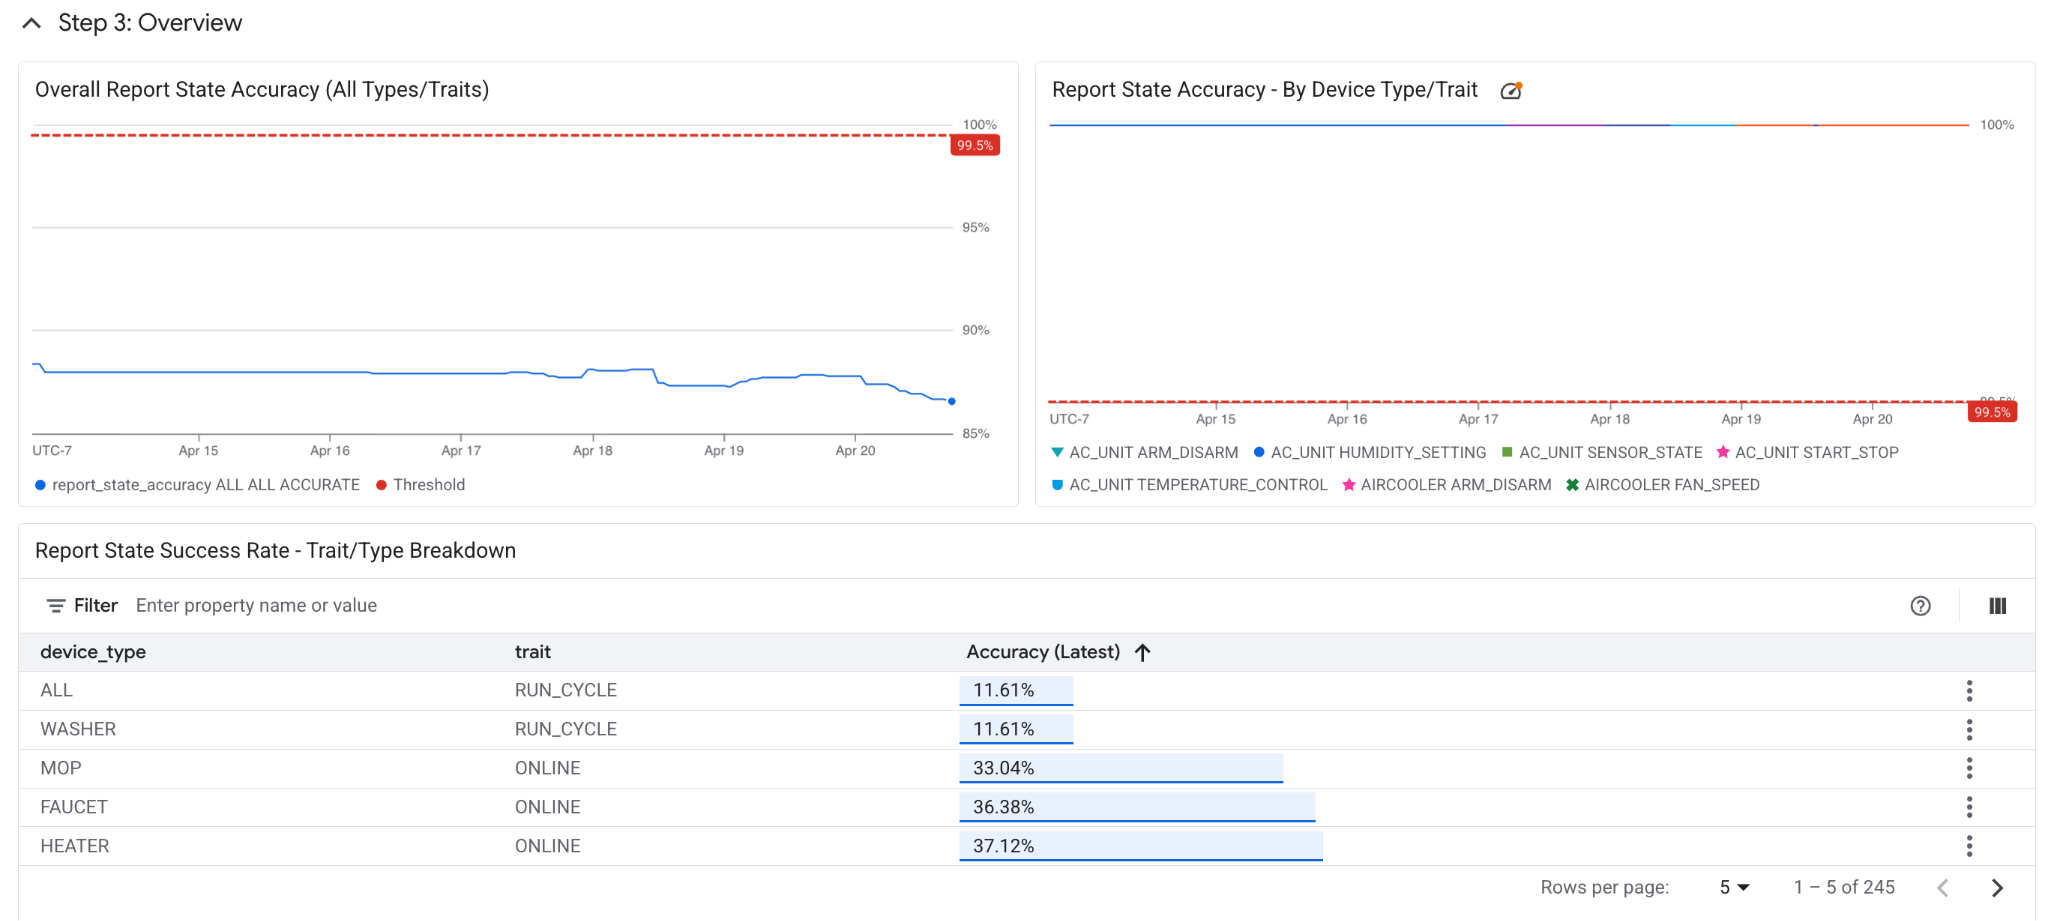
Step 3: Overview
With both Step 1 and Step 2 debugged, Step 3 covers the accuracy of Report State – the device states stored in Google systems, which are used to serve user queries. Breakdowns by trait and device type are shown below. Steps 3a and 3b cover two common errors for Report State, Missing Field errors and Inaccurate errors.
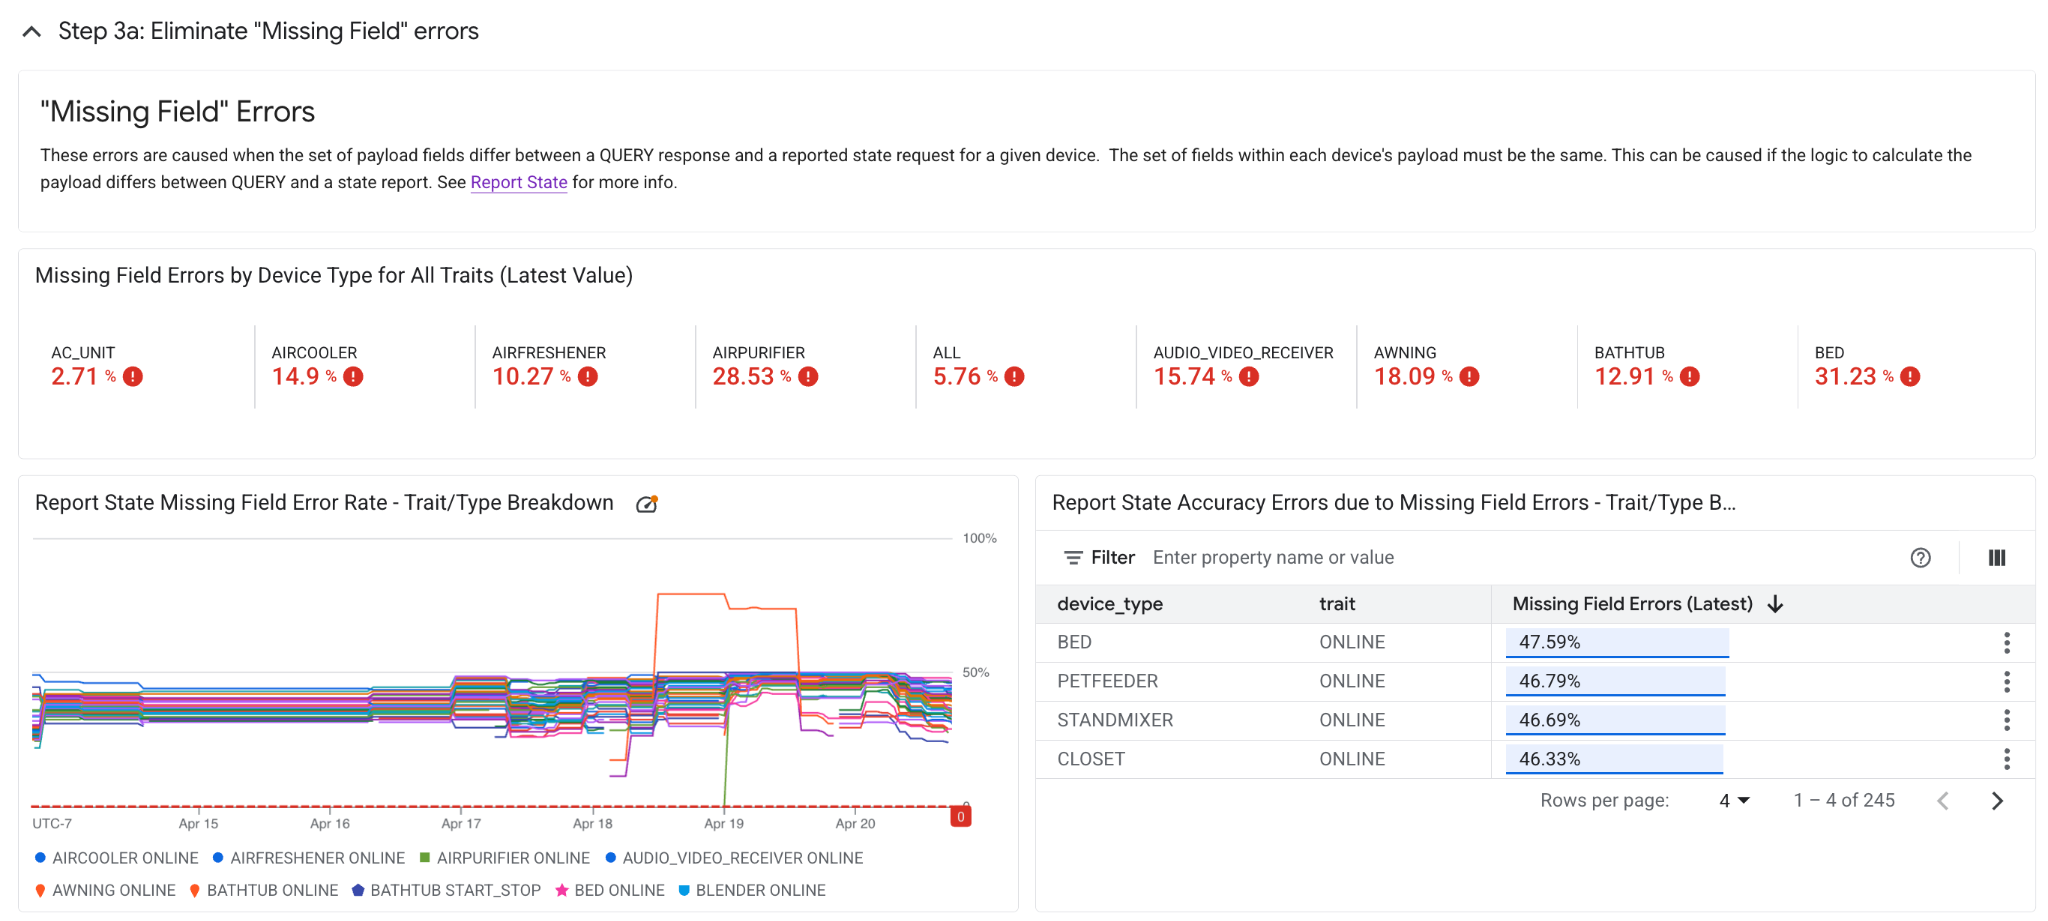
Step 3a: "Missing Field" errors
"Missing Field" errors are caused when the set of payload fields differ between a QUERY response and a reported state request for a given device. The set of fields within each device's payload must be the same. This can be caused if the logic to calculate the payload differs between its QUERY and report state response. Use the charts below to trace which device types and traits have mismatching QUERY and report state responses.
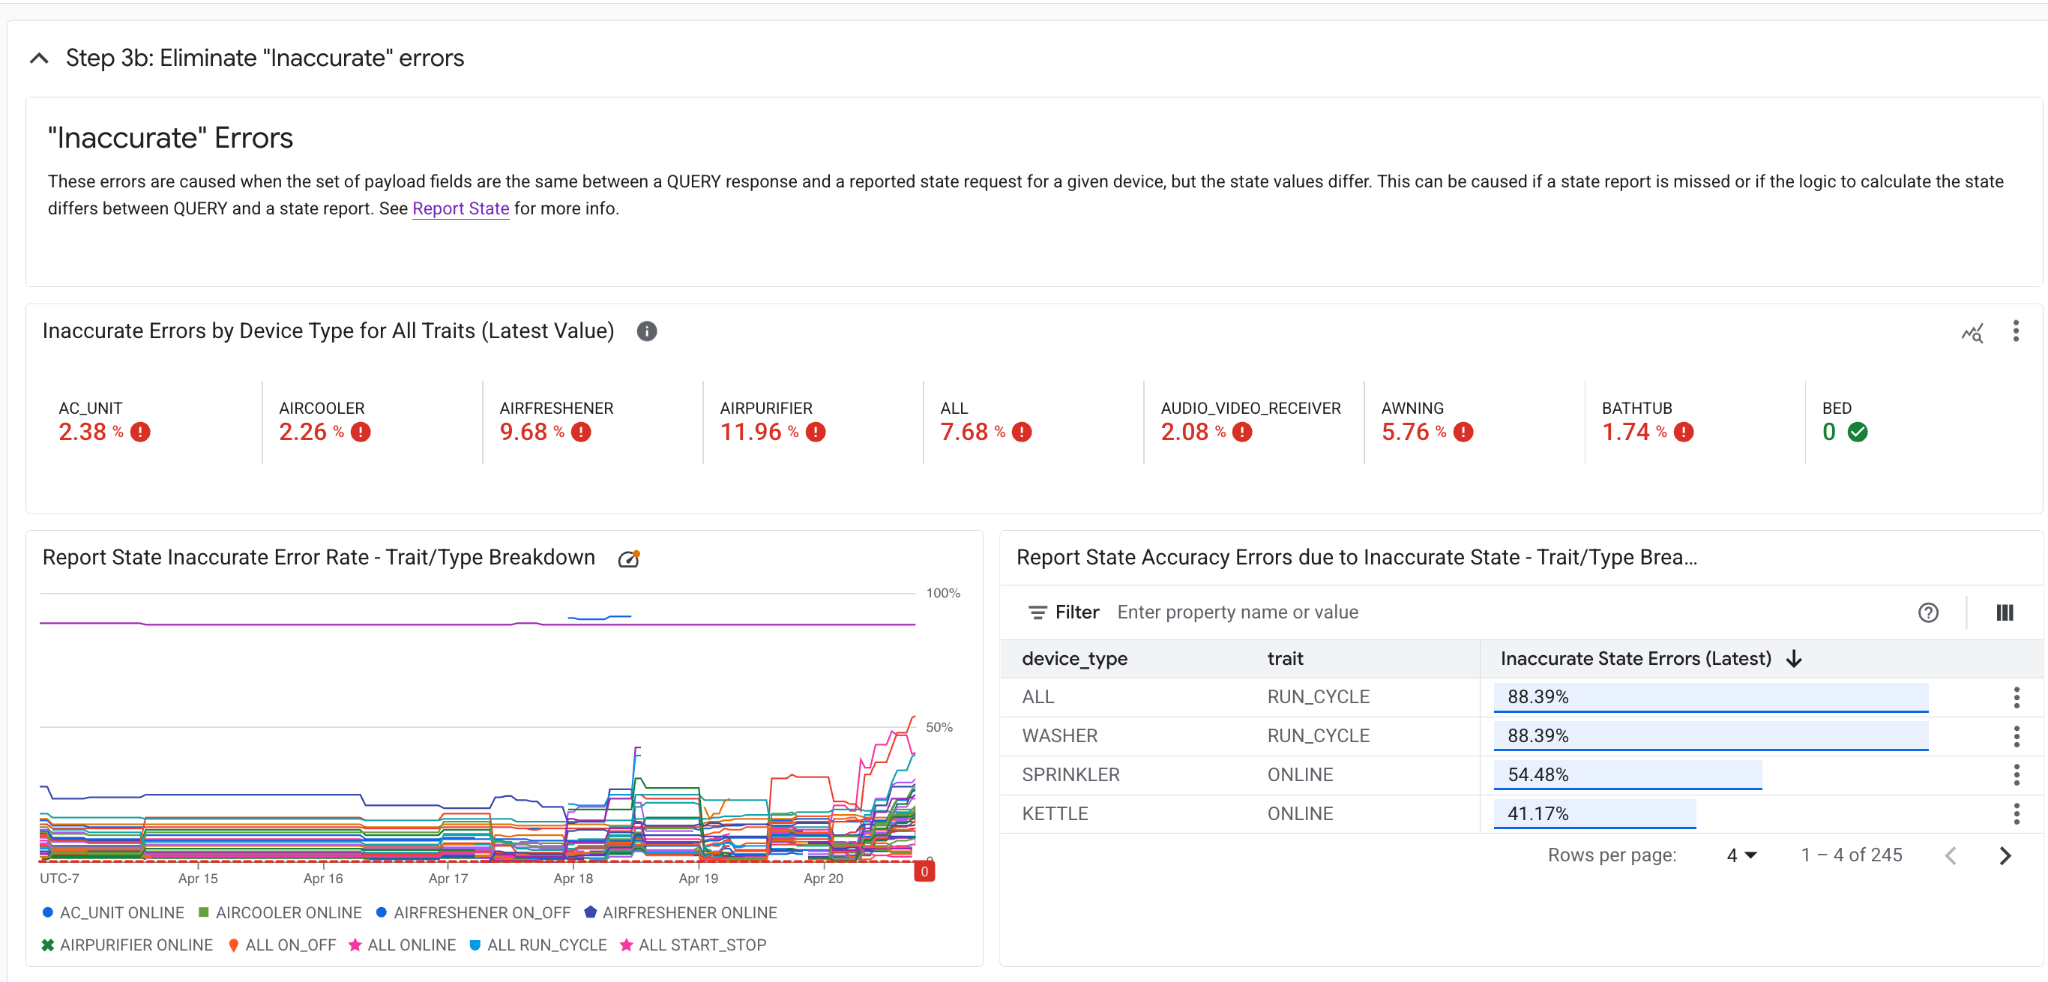
Step 3b: "Inaccurate" errors
Inaccurate errors are caused when the set of payload fields are the same between a QUERY response and a reported state request for a given device, but the state values differ. This can be caused if a state report is missed or if the logic to calculate the state differs between QUERY and a state report. Use the charts below to trace which device types and traits have mismatching QUERY and report state responses.
6. Other documentation & resources
- To send feedback or report issues for this dashboard, file an issue in our public Issue Tracker.
- To file an appeal request, file an issue using our Quality Metric Appeal form.
- To regularly stay aware of your integration quality, configure Google Cloud Platform alerts to get notifications when your metrics fall below an acceptable threshold. This ensures you are the first to know when an issue arises.
- For all other information, please follow see more info at developer's documentation – https://developers.home.google.com/tools/analytics/home-vitals