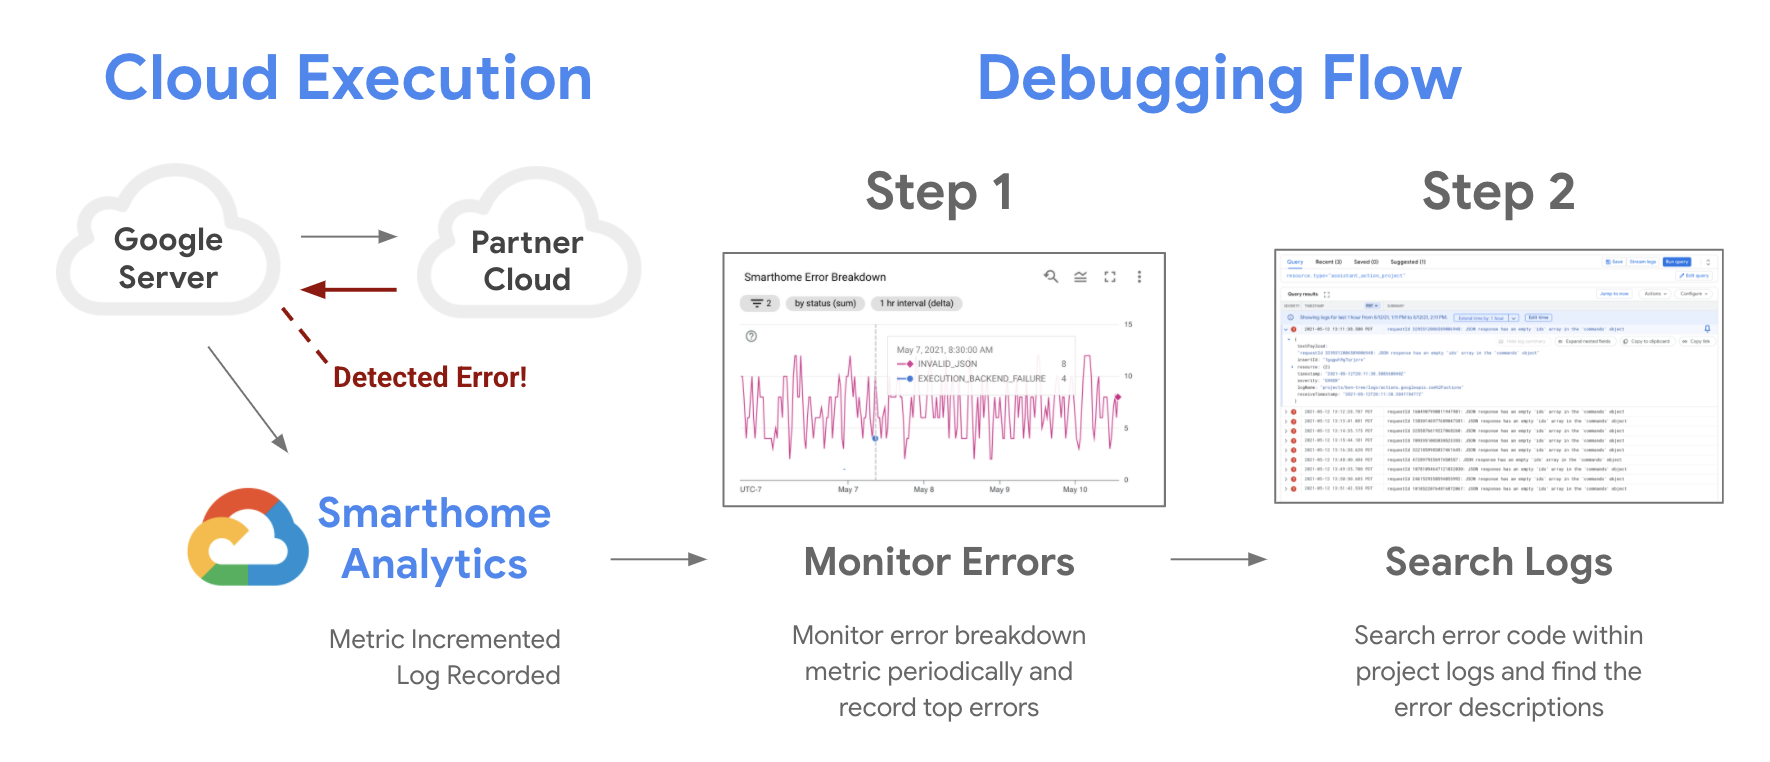
Google Cloud provides you the tools to monitor the reliability of your projects with Google Cloud Monitoring and debug issues with Google Cloud Logging error logs. Whenever a failure happens when fulfilling user intents, Google Home Analytics pipeline records that failure on your metrics, and publishes an error log in your project logs.
There are two steps to troubleshooting your errors:
- Monitor the state of your projects with smart home metrics.
- Investigate issues by checking the detailed error descriptions in the error logs.

Optionally, you can test your Action by sharing it with other users. Make sure to handle errors and exceptions appropriately.
Monitoring errors
You can use Google Cloud Monitoring dashboards to access your project metrics. There are some key charts that are especially useful for monitoring quality and debugging:
- The Success Rate chart is the first chart to start from when you are monitoring the reliability of your projects. Drops in this chart can indicate an outage for a portion or all of your user base. We recommend closely monitoring this chart for any irregularities after each change or update to your project.
- The 95th Percentile Latency chart is an important indicator for how your Cloud-to-cloud integration is performing for your users. Sudden fluctuations in this chart might indicate your systems might be unable to catch up with the requests. Periodically checking this chart is advised to see any unexpected behavior.
- The Error Breakdown charts are most useful when it comes to troubleshooting issues on your integrations. For every error highlighted in your success percentage chart, an error code is displayed in your error breakdown. You can see the errors flagged by the Google Home platform and how to troubleshoot them in the table below.
Common platform error codes
Here are some common error codes that you may see in your project logs to identify issues caught by the Google Home platform. Refer to the following table for troubleshooting information. For a full list of error codes, see Errors and exceptions.
| Error Code | Description | Partner Actionable |
|---|---|---|
AGENT_ISSUE |
A general issue occurred with the partner's cloud agent.
Check for unhandled exceptions or crashes in your fulfillment logs. |
Yes |
AGENT_UNAVAILABLE_ERROR |
Google couldn't reach the partner's fulfillment URL.
Ensure your server is online, firewall isn't blocking Google, and the URL is correct. |
Yes |
BACKEND_FAILURE_URL_TIMEOUT |
Google's request timed out when trying to reach your service.
Verify that your service is online, accepting connections, and is not over capacity. Additionally, verify that the target device is powered on, online, and synced. |
|
BACKEND_FAILURE_URL_UNREACHABLE |
Google has received an HTTP 5xx error code from your service.
Use the requestId in Google Cloud Logging to check
your smart home service logs. Investigate server crashes, timeouts,
or 502/503 Gateway errors.
|
|
COMMAND_FAILED |
A generic failure occurred during the execution of a command.
Check your fulfillment logs for the specific requestId
to find the root cause.
|
Yes |
EXECUTION_BACKEND_FAILURE_URL_ERROR |
Google received an HTTP 4xx error (other than 401) from your
fulfillment.
Check your web server logs for 403, 404, or 400 responses. |
Yes |
EXECUTION_BACKEND_FAILURE_URL_ROBOTED |
The fulfillment URL is blocked by robots.txt or security filters.
Ensure your fulfillment endpoint is accessible to Google's crawlers/services. |
Yes |
EXECUTION_BACKEND_FAILURE_URL_UNREACHABLE |
Google received an HTTP 5xx error from your fulfillment service.
Ensure the endpoint URL service is stable, correct and publicly reachable, service is running. Add health checks and retry handling. Investigate server crashes, timeouts, or 502/503 Gateway errors. |
Yes |
EXECUTION_BAILOUT_INVALID_RESPONSE |
The JSON response was so malformed that processing was aborted.
Use a JSON validator to ensure your response strictly follows the Intent schemas. |
Yes |
EXECUTION_GAL_BAD_3P_RESPONSE |
Account linking failed due to an invalid format in the token response.
Verify your OAuth server's response format matches Google's requirements. |
Yes |
EXECUTION_GAL_INSUFFICIENT_CAPABILITIES |
The user's account lacks the necessary permissions for this action.
Check scopes requested during OAuth and ensure they match the required traits. |
Yes |
EXECUTION_GAL_MAYBE_UNLINKED_BY_3P |
The partner cloud indicates the user has unlinked their account.
Ensure your agentUserId mapping is stable and hasn't
been purged.
|
Yes |
EXECUTION_GAL_NOT_FOUND |
The user's access and refresh tokens stored in Google are invalid or
cannot be refreshed, preventing authentication and access to the
partner service.
Ensure tokens remain valid and synchronized, handle account status changes appropriately, and require users to re-link the account if tokens are confirmed to be revoked. |
|
EXECUTION_GAL_READ_ONLY_MODE_FOR_3P |
The integration is in a read-only state on the partner side.
Check if the user's account is suspended or in a "view-only" maintenance mode. |
Yes |
EXECUTION_GAL_UNLINKED_BY_3P |
The account was proactively unlinked by the third-party service.
Investigate why the user was disconnected (for example, security reset). Ensure partner's OAuth server correctly responds to Google's refresh_token requests to issue new access tokens
seamlessly.
|
Yes |
EXECUTION_INVALID_JSON |
The JSON response payload couldn't be parsed by Google.
Check for syntax errors, missing brackets, or invalid characters in your response. |
Yes |
INVALID_AUTH_TOKEN |
Google has received an HTTP 401 error code from your service.
The access token is not expired but your service has invalidated it. Use the requestId in Google Cloud Logging to check your
smart home service logs.
|
|
INVALID_JSON |
The response structure is invalid (for example, missing mandatory
fields).
Validate your response against the Intent JSON Schemas. |
Yes |
MALFORMED_JSON |
The JSON structure is broken (for example, unclosed strings or
objects).
Ensure your fulfillment uses a standard JSON library to serialize responses. |
Yes |
NOT_IMPLEMENTED |
The requested intent or trait has not been implemented by the partner.
Only include traits in your SYNC response that you have
fully implemented.
|
Yes |
OPEN_AUTH_FAILURE |
User's access token is expired and Google is unable to refresh it,
or Google has received an HTTP 401 error code from your service.
If you see an increased rate of this code, check if you also see an increased rate of errors related to smart home intents or refresh token requests. |
|
PARTNER_RESPONSE_INVALID_ERROR_CODE |
The errorCode string returned is not in Google's
supported list.
Map your internal errors to the Official Error List. |
Yes |
PARTNER_RESPONSE_INVALID_PAYLOAD |
The payload field in the response is not a valid JSON
object.
Verify the root structure of your fulfillment response. |
Yes |
PARTNER_RESPONSE_INVALID_STATUS |
The response status was not SUCCESS, ERROR, or OFFLINE.
Ensure every device result in your response includes a valid status string. |
Yes |
PARTNER_RESPONSE_MISSING_COMMANDS_AND_DEVICES |
The response did not include results for all requested
commands/devices.
Validate your response structure against the Google Home developer documentation. Ensure the response is not being truncated or returning an empty body due to an internal server error. Every item in the request's commands array must have a
corresponding response entry.
|
Yes |
PARTNER_RESPONSE_MISSING_DEVICE |
A specific device requested by Google was omitted from the response.
Ensure your response includes every ID provided in the
request payload.
|
Yes |
PARTNER_RESPONSE_MISSING_PAYLOAD |
The response is missing the mandatory payload field.
Ensure your top-level JSON object includes a payload key.
|
Yes |
PARTNER_RESPONSE_NOT_OBJECT |
The entire response couldn't be parsed as a JSON object.
Check for trailing characters or non-JSON content in your HTTP response body. Ensure payload.commands[] is a proper JSON
object with ids, status, and optional states.
|
Yes |
REQUEST_ID_NOT_FOUND |
Google couldn't find the internal tracking ID for the request.
Usually an internal platform error; monitor for spikes and contact support. |
Yes |
RESOURCE_UNAVAILABLE |
The requested resource (device or trait) is unavailable.
Check if the device is "Busy" or has been temporarily disabled. |
Yes |
RESPONSE_TIMEOUT |
The fulfillment service failed to respond within 9 seconds.
Optimize backend latency; check for slow DB queries or regional network lag. |
Yes |
RESPONSE_UNAVAILABLE |
No response was received from the partner fulfillment URL.
Verify your service is running and the endpoint is not crashing. |
Yes |
TIMEOUT |
A general timeout occurred while processing the intent.
Check logs for internal service timeouts between your cloud and device hubs. |
Yes |
Search Logs
Once you get comfortable monitoring your integrations using metrics, the next step is to troubleshoot specific errors using Cloud Logging. An error log is a JSON-like entry with fields containing useful information like time, error code and details regarding the originating smart home intent.
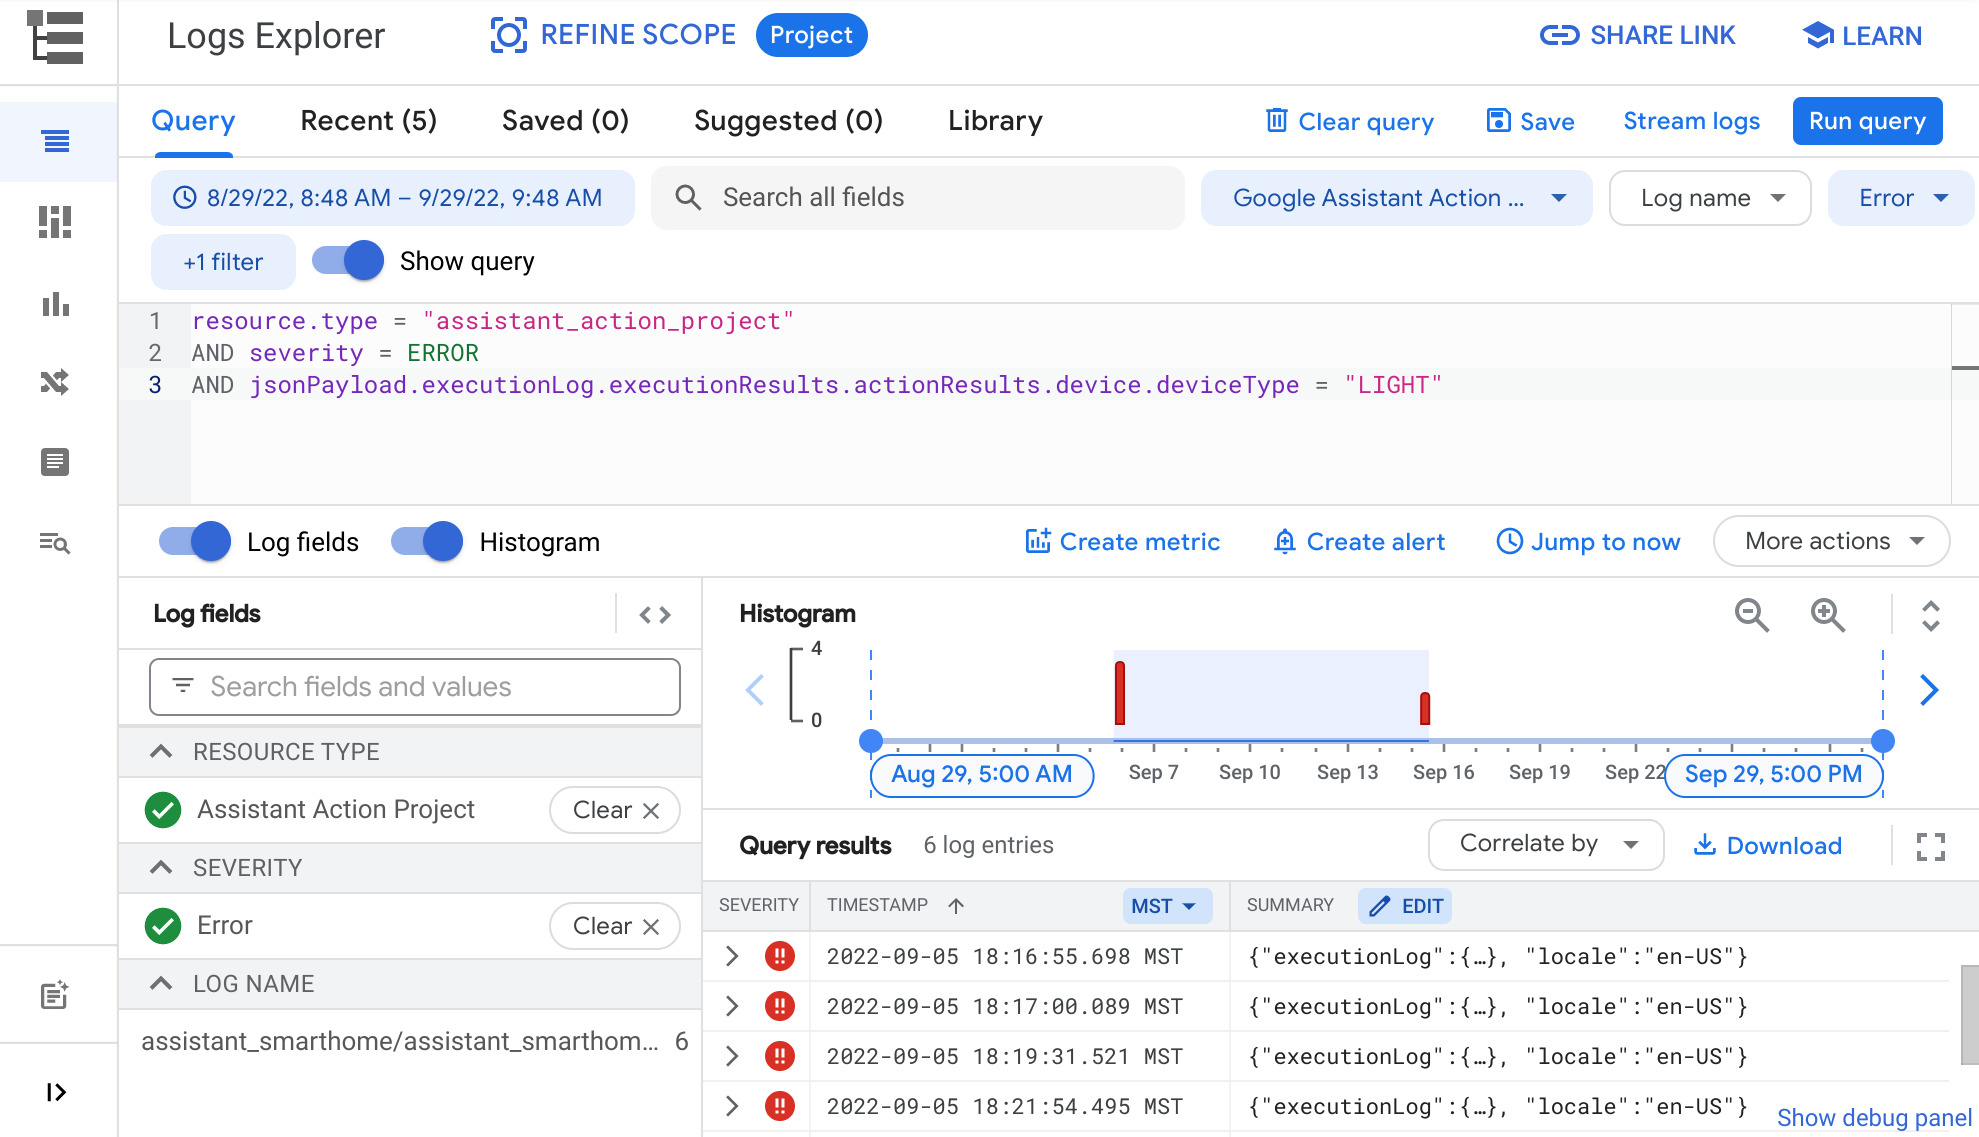
There are multiple systems within Google Cloud that send logs to your project at all times. You need to write queries to filter your logs and find the ones you need. Queries can be based on a Time Range, Resource, log Severity or custom entries.

You can use the query buttons to help you build your custom filters.

To specify a Time Range, click the time range selection button and choose one of the provided options. This will filter the logs and show the ones that originate in the selected time range.
To specify a Resource, click the Resource dropdown, then choose Google Assistant Action Project. This adds a filter in your query to show logs that originate from your project.
Use the Severity button to filter by Emergency, Info, Debug, and other severity log levels.
You can also use the Query field in the Logs Explorer
to enter custom entries. The query engine used by this field supports both
basic queries like string matching, and more advanced types of queries including
comparators (<, >=, !=) and boolean operators (AND, OR, NOT).
For example, the custom entry below would return errors that
originate from a LIGHT device type:
resource.type = "assistant_action_project" AND severity = ERROR AND jsonPayload.executionLog.executionResults.actionResults.device.deviceType = "LIGHT"
Visit the Query Library to find more examples for querying logs effectively.
Testing Fixes
Once you identify errors and apply updates to fix them, we recommend testing your fixes thoroughly with Google Home Test Suite. We provide a user guide on how to use Test Suite, which walks you through testing your changes effectively.
Learning Resources
This document provides the steps to troubleshoot errors in your Smart Home Action. You can also check our codelabs to learn more on debugging:
- Debugging Smart Home Codelab: Quick start guide to debug smart home cloud integration.
- Debugging Local Home Codelab: Quick start guide to debug smart home local integration.
